A practical demonstration of Whylitics' approach to internal organizational research.
This article illustrates our internal research process using a publicly available dataset to maintain client confidentiality.
At Whylitics, our Employee & Organizational Research service is designed to help companies improve team dynamics, increase retention, and boost workplace performance. Understanding why employees leave—or stay—is critical for fostering sustainable organizational success.
As real company data remains private, we demonstrate our method using an open-source dataset from Kaggle.
The goal was to uncover the main drivers behind employee attrition and build models that allow HR departments to proactively address retention risks.
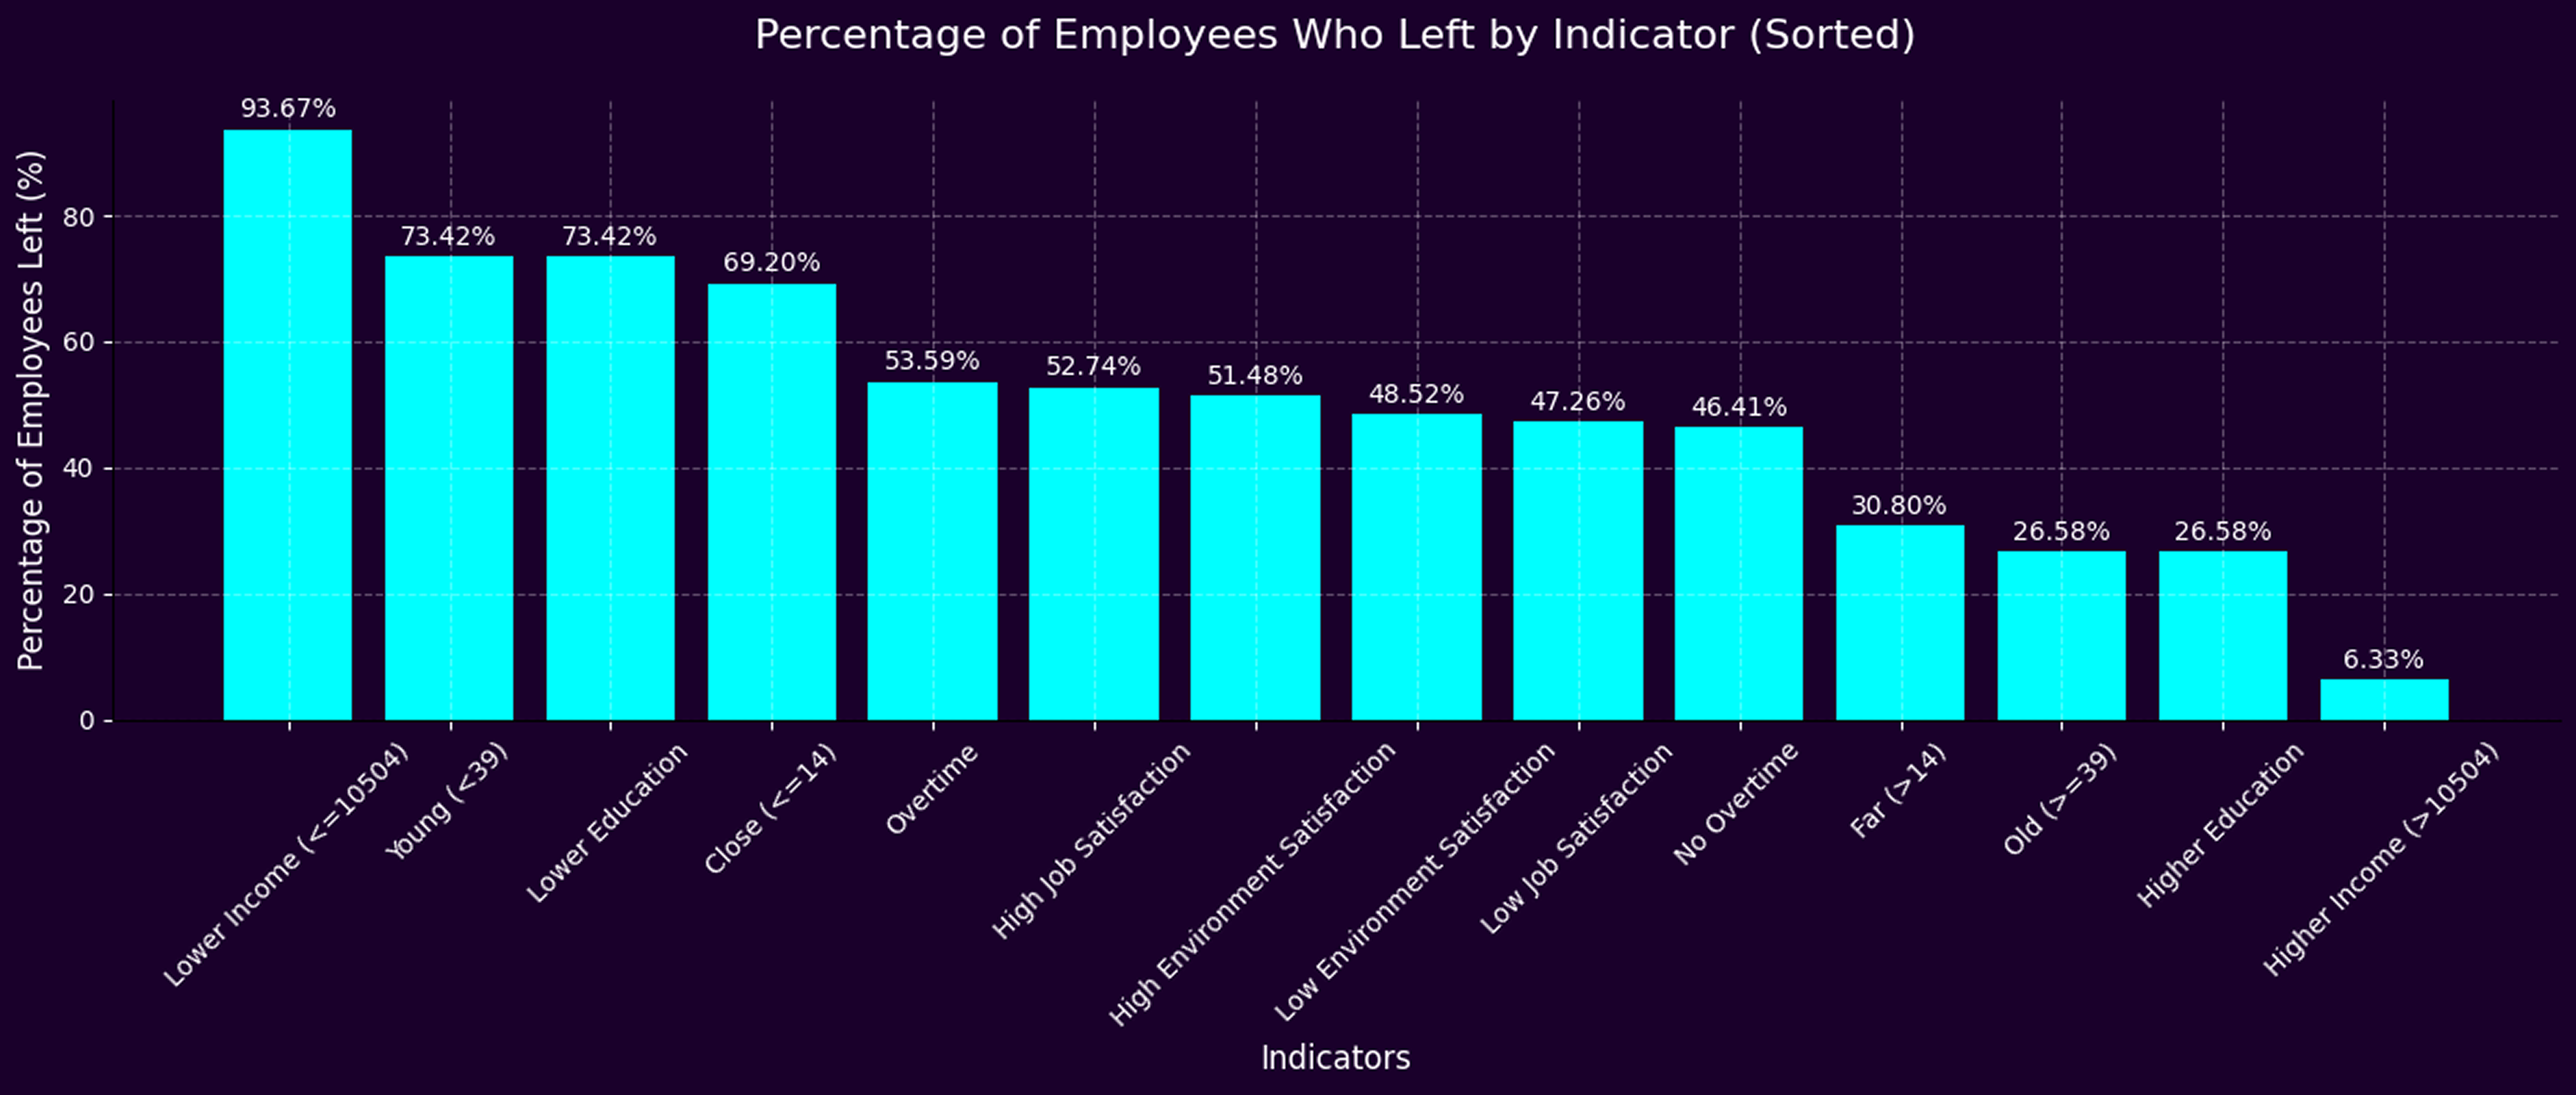
To understand what drives employee attrition, we conducted a segmented analysis based on several internal indicators. Employees were grouped by characteristics such as age, income, education level, job satisfaction, environmental satisfaction, overtime status, and distance from home. For each group, we measured the percentage of individuals who left the company.
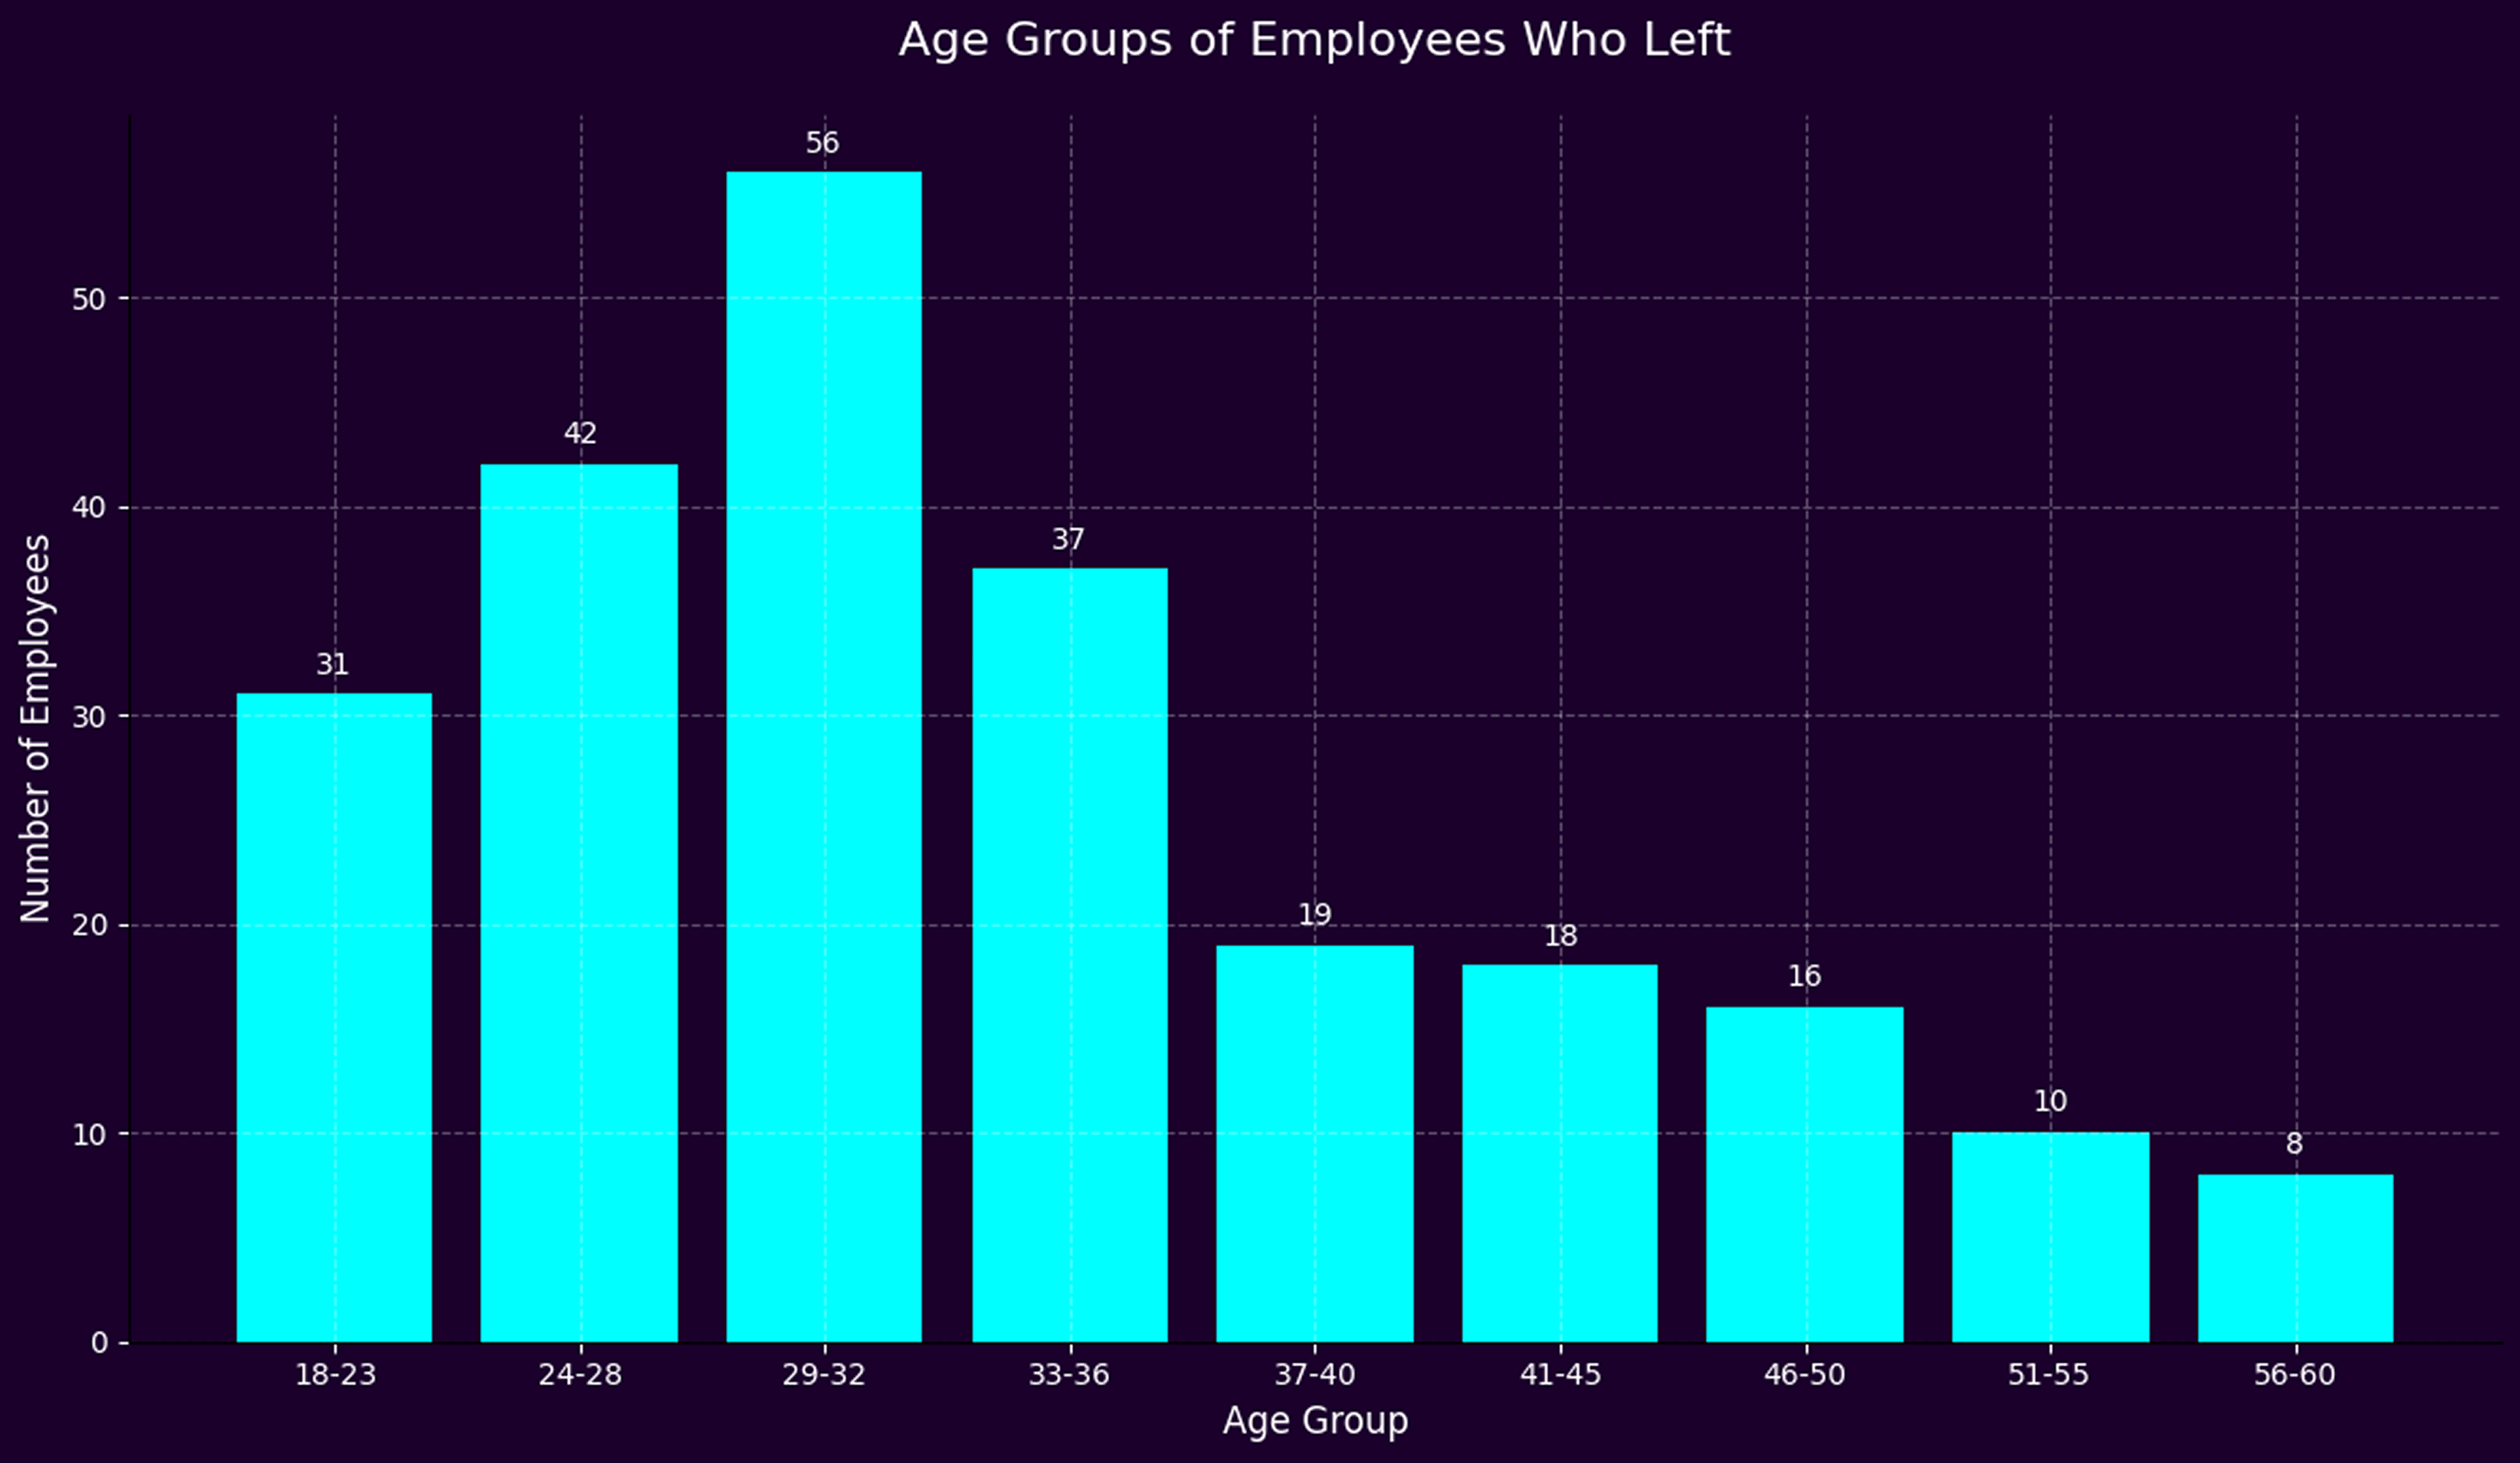
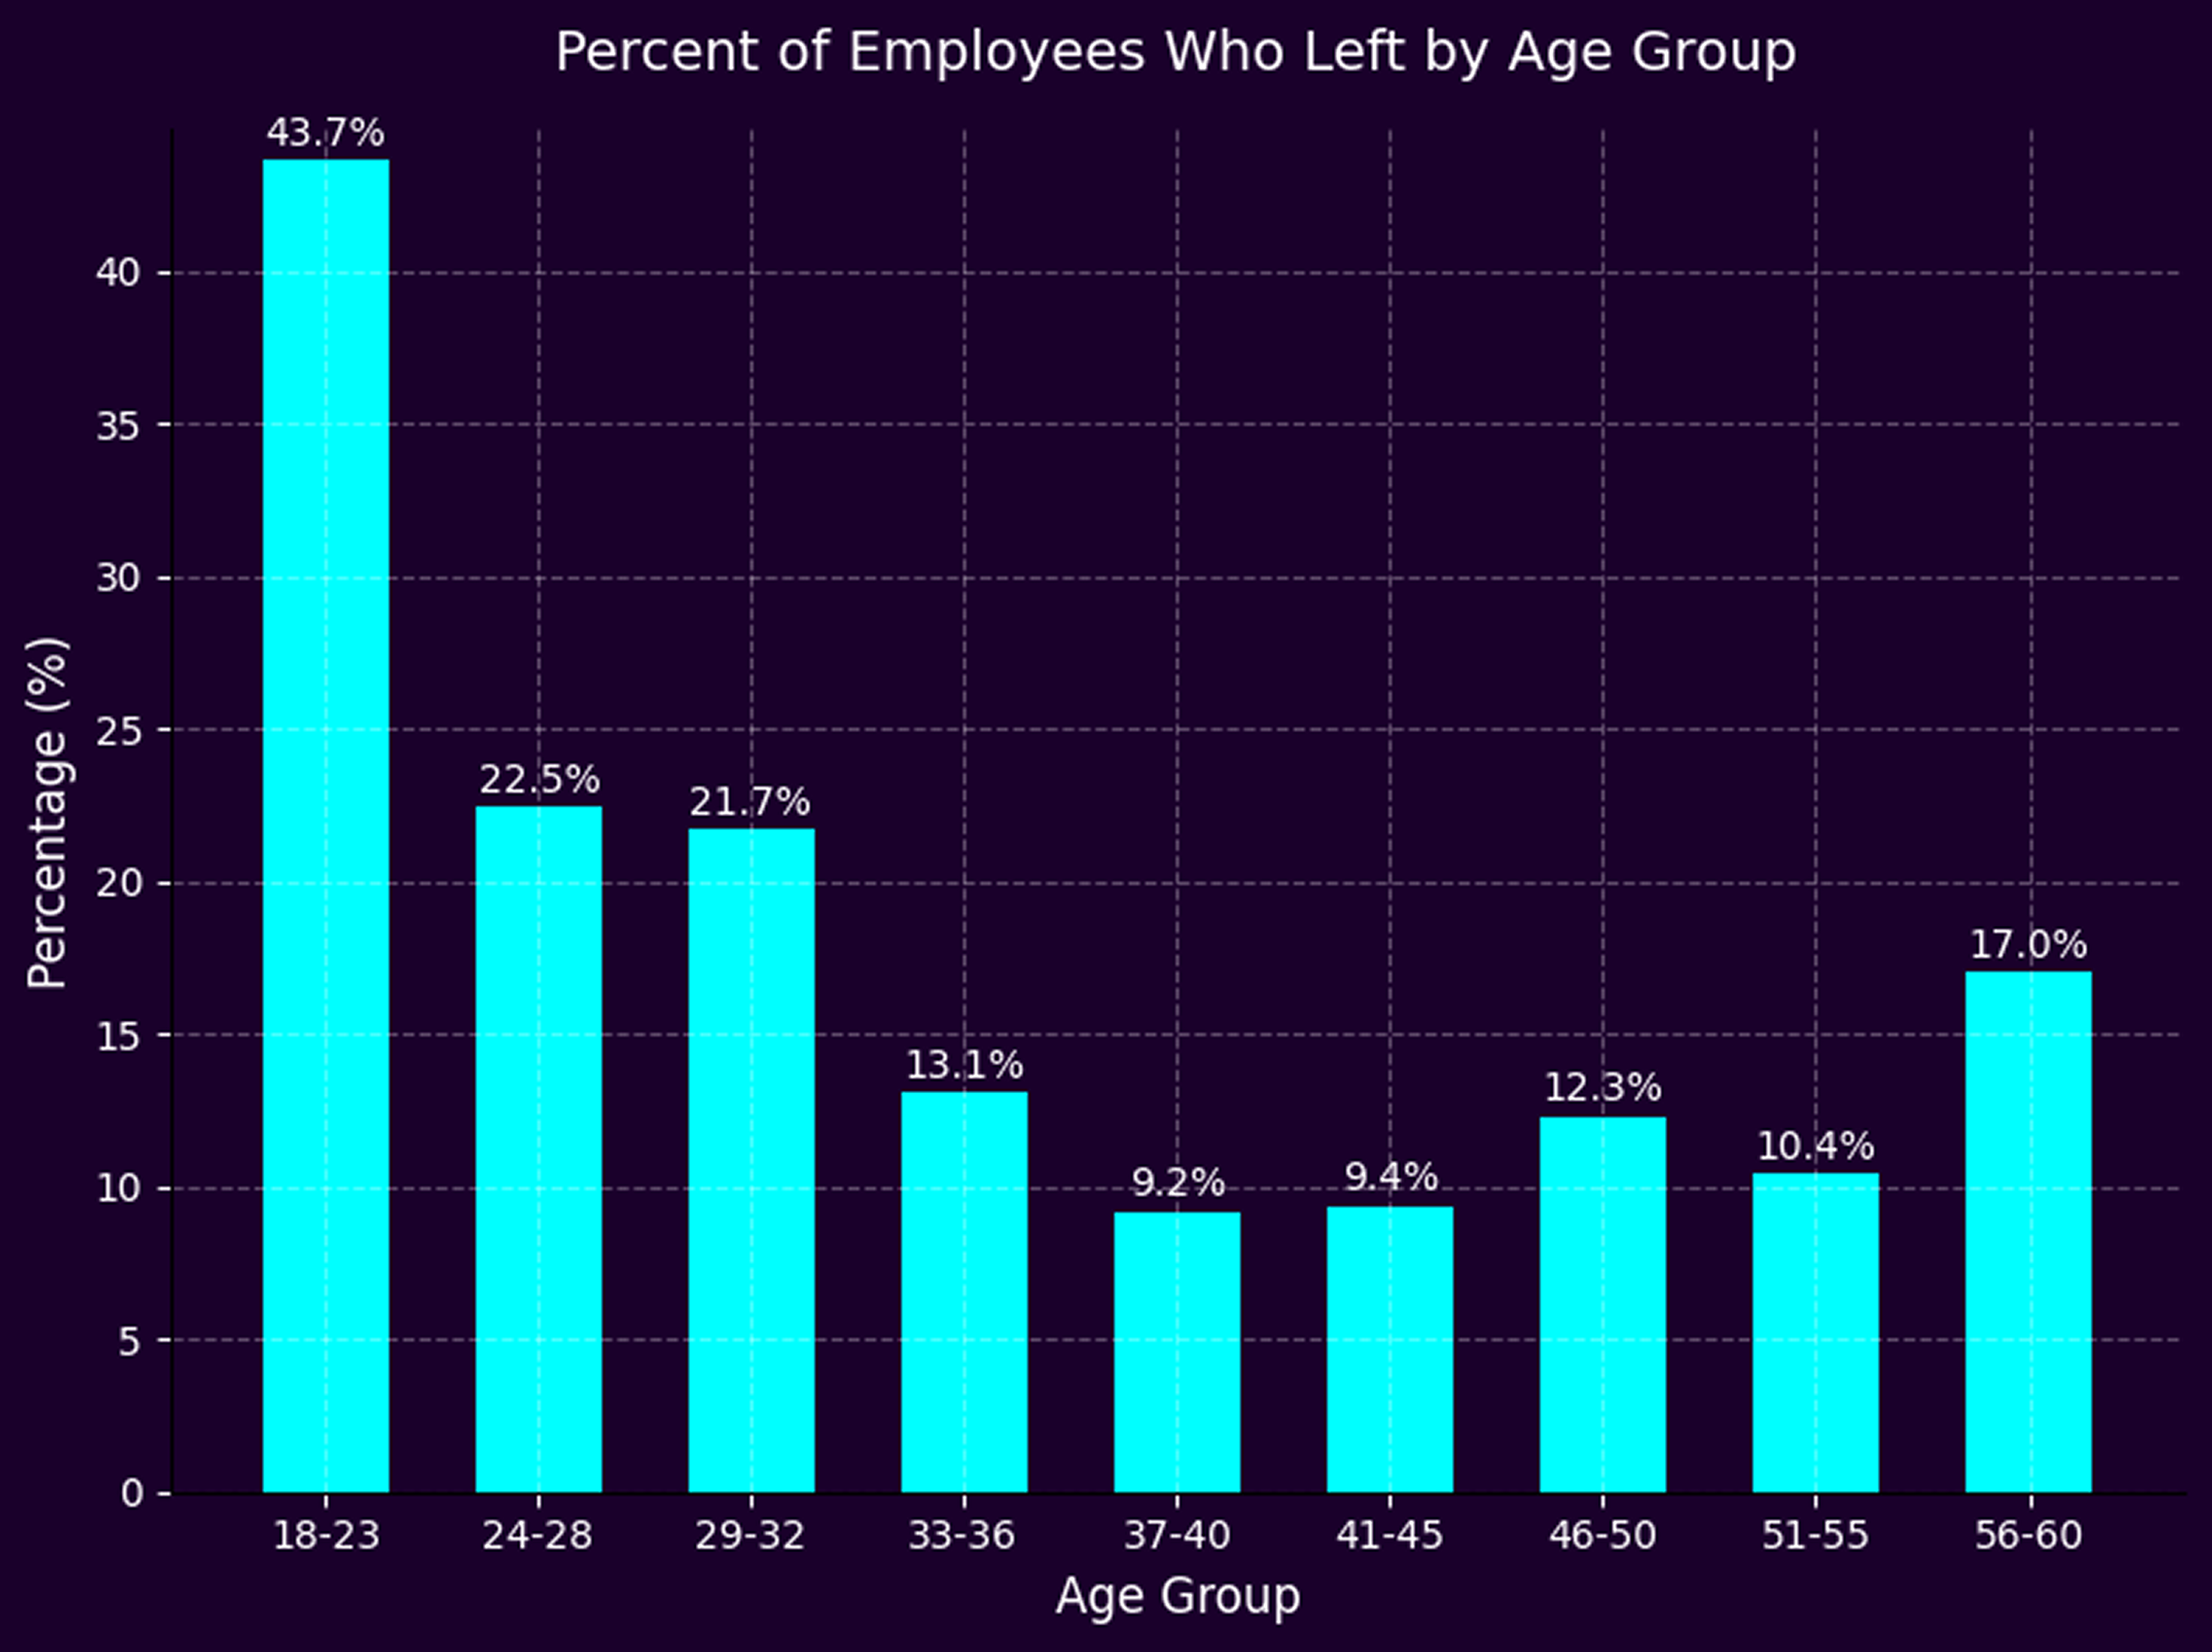
Age was one of the most revealing indicators. While the highest absolute number of leavers came from the 29–32 age group, the highest attrition rate occurred in the youngest employees (18–23), suggesting early-career talent is more prone to churn.
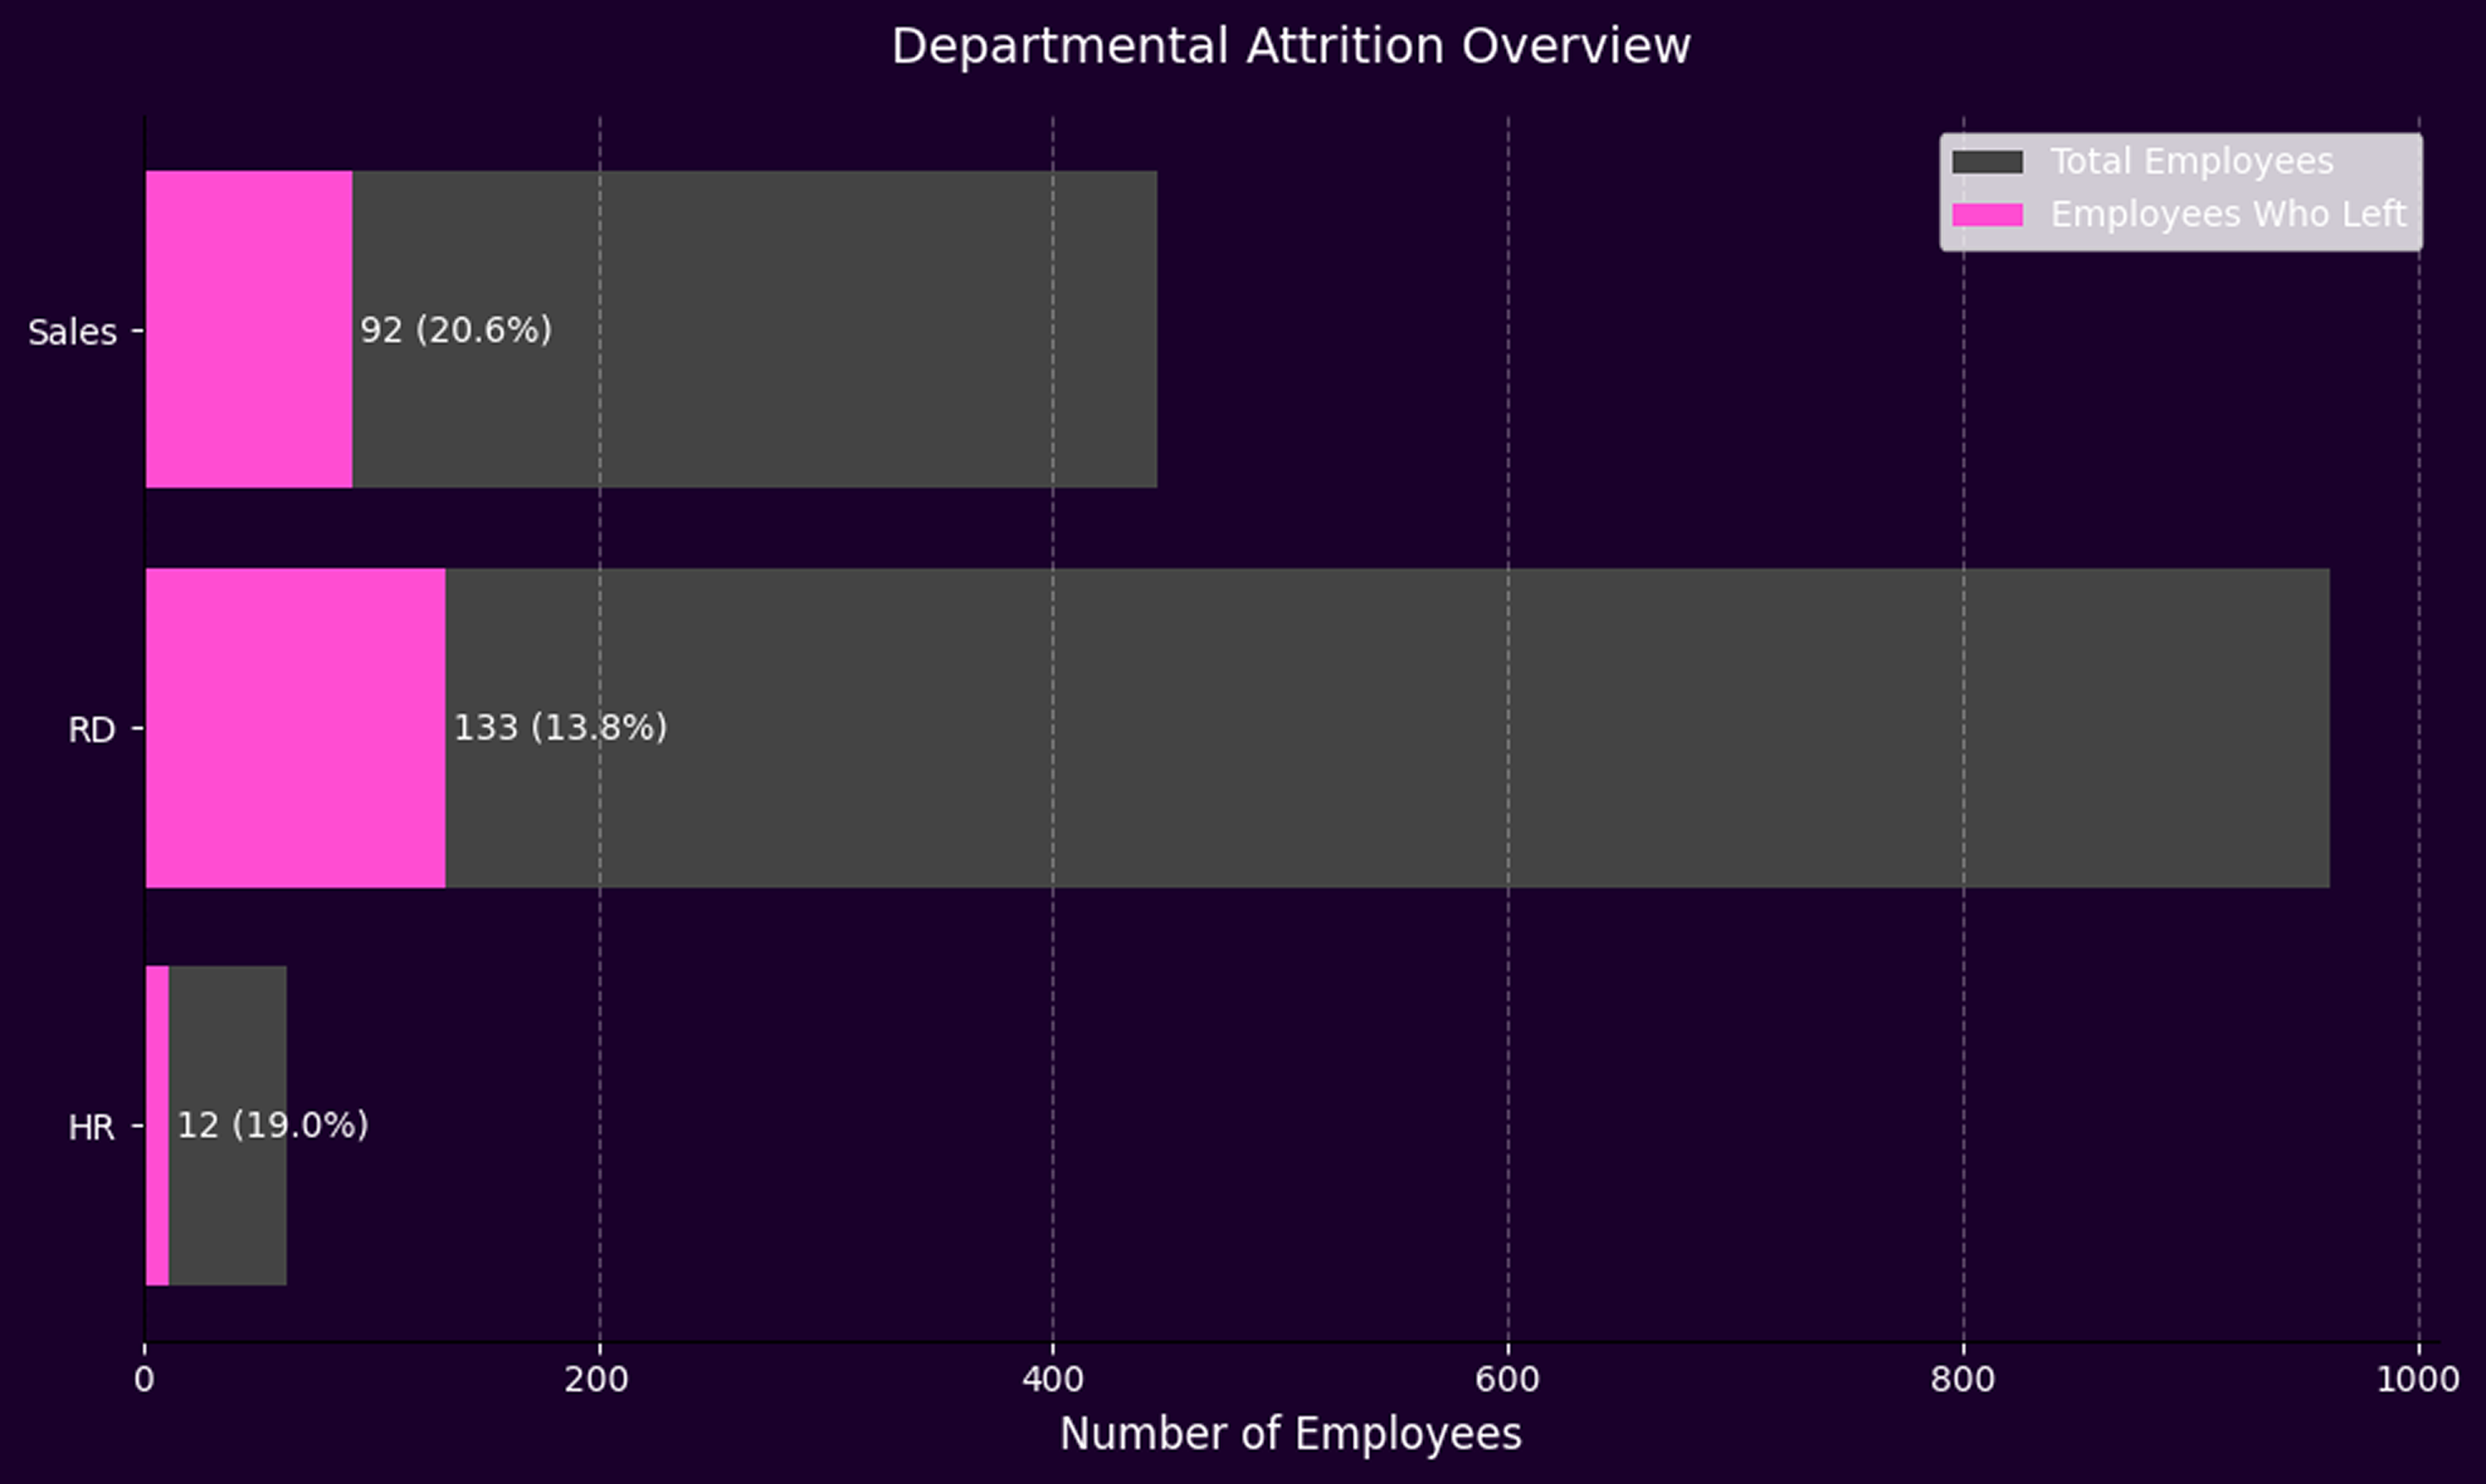
Department affiliation offered another lens into attrition trends. While the largest number of leavers came from the Research & Development (R&D) department—133 employees—this aligns with its size, comprising the majority of the company’s workforce. When adjusting for department size, a more nuanced pattern emerged: the Sales department exhibited the highest attrition rate at 20.63%, followed closely by Human Resources at 19.05%, while R&D showed a comparatively lower rate of 13.84%.
Commute distance showed a noticeable—but not drastic—effect on attrition. While employees living closer (1–10 km) had attrition rates around 13–15%, those farther away (11–26 km) experienced rates rising to over 20%, peaking at nearly 25% for those 23–26 km from work. Although the difference is not sharply pronounced, the upward trend suggests that longer commutes may contribute to increased turnover, especially over 10 km.
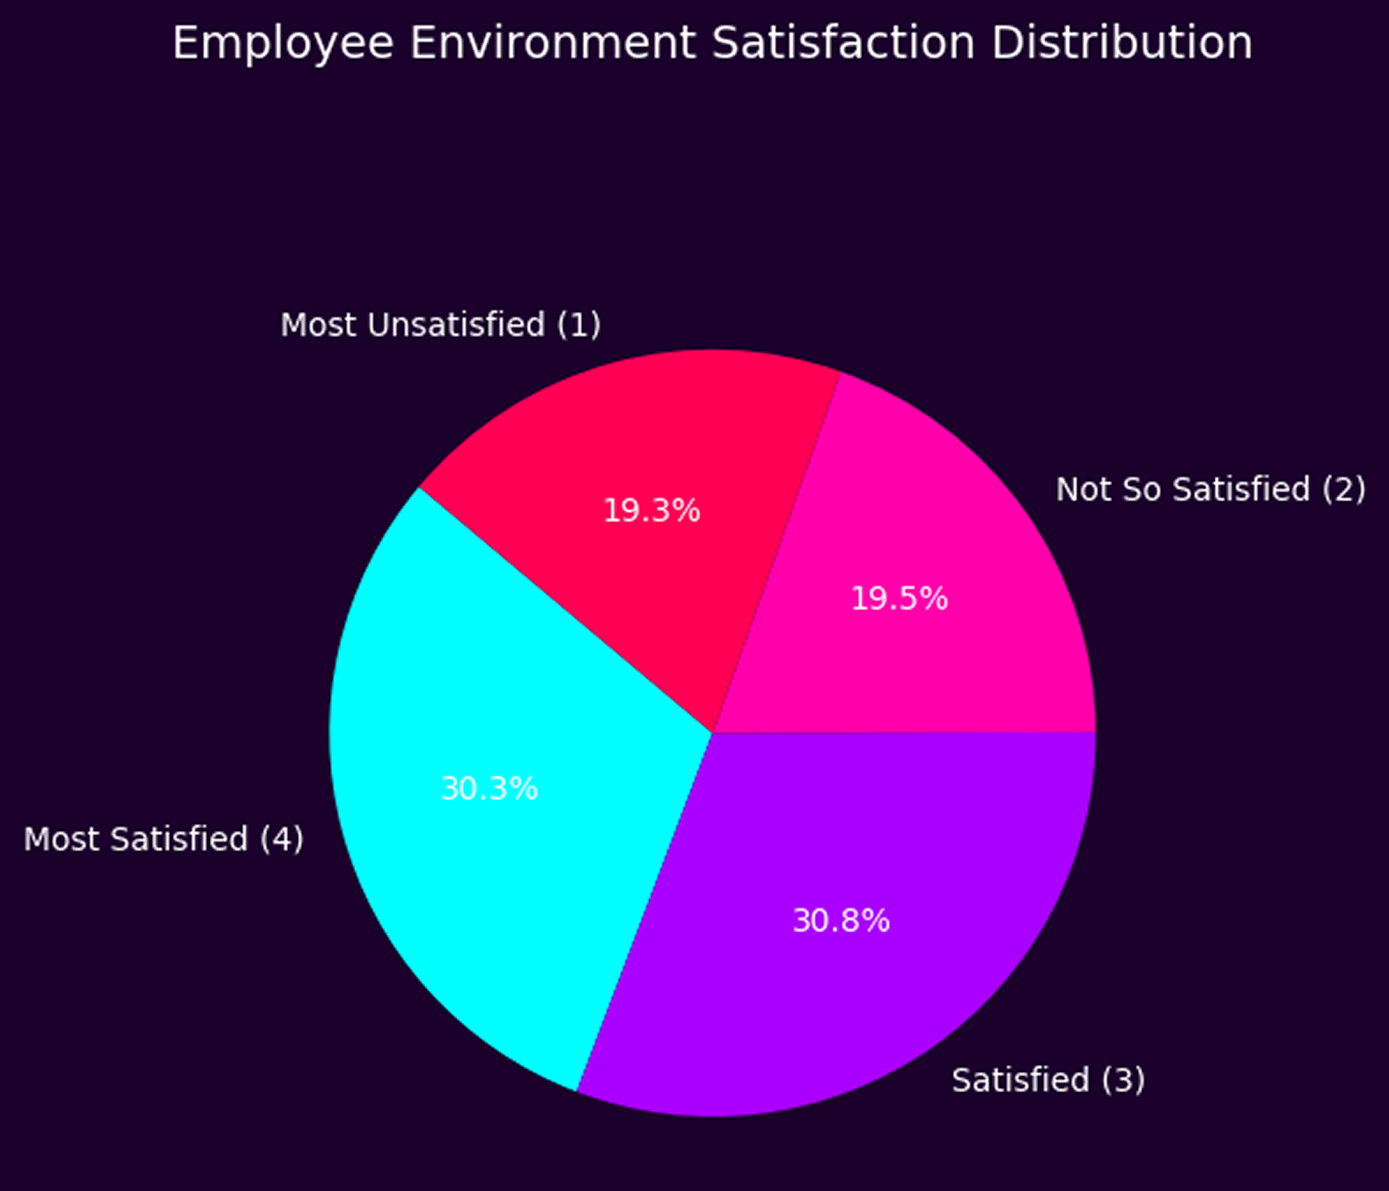
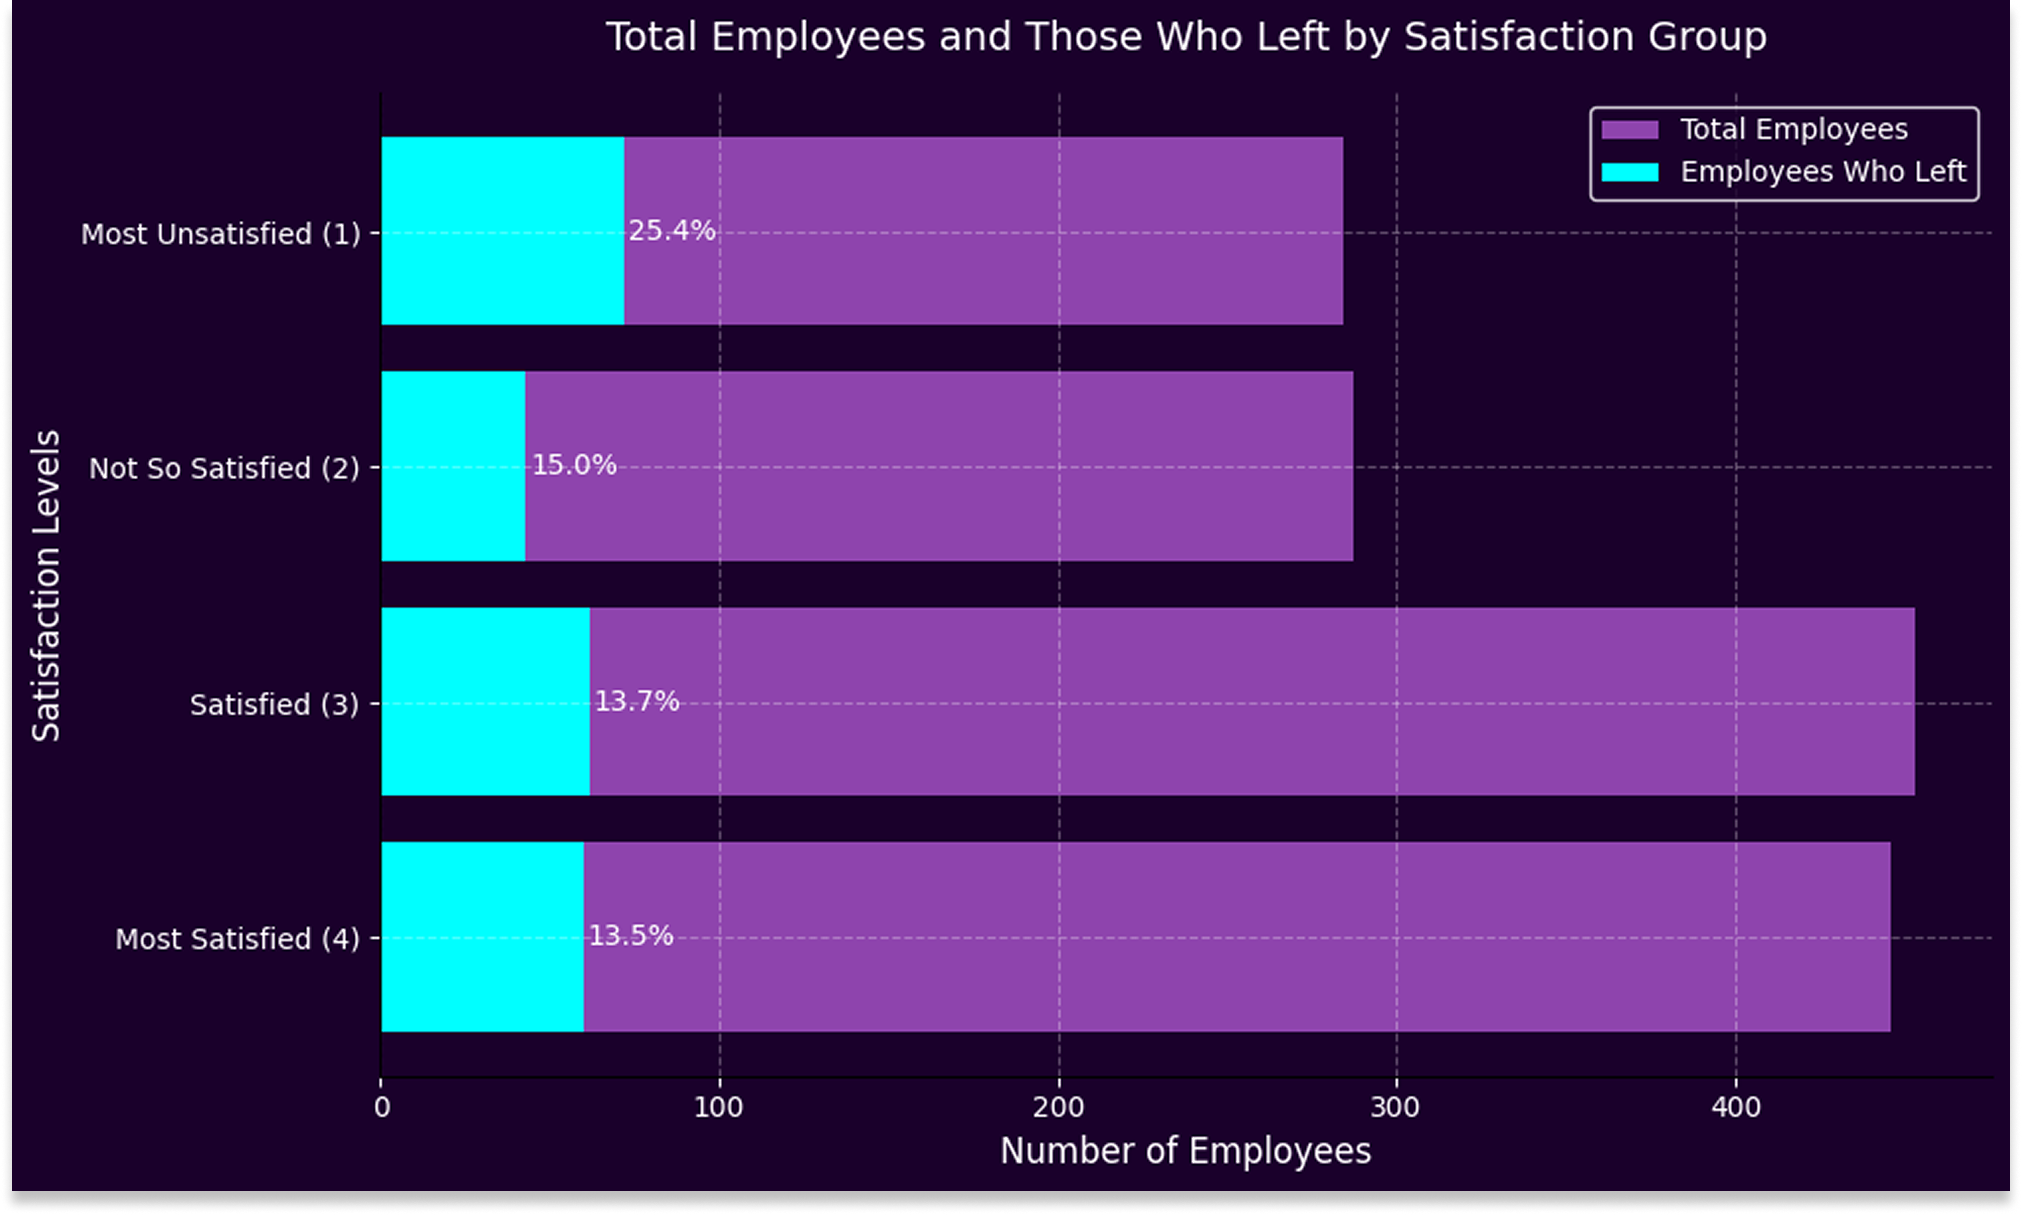
Environment satisfaction showed a clear relationship with attrition. While overall satisfaction levels were fairly balanced across the workforce, employees with the lowest satisfaction had the highest attrition rate—25.35%. In contrast, only 13–14% of those who reported being satisfied or very satisfied chose to leave. This trend indicates that dissatisfaction with the work environment plays a measurable role in turnover, though it's not the sole determining factor.
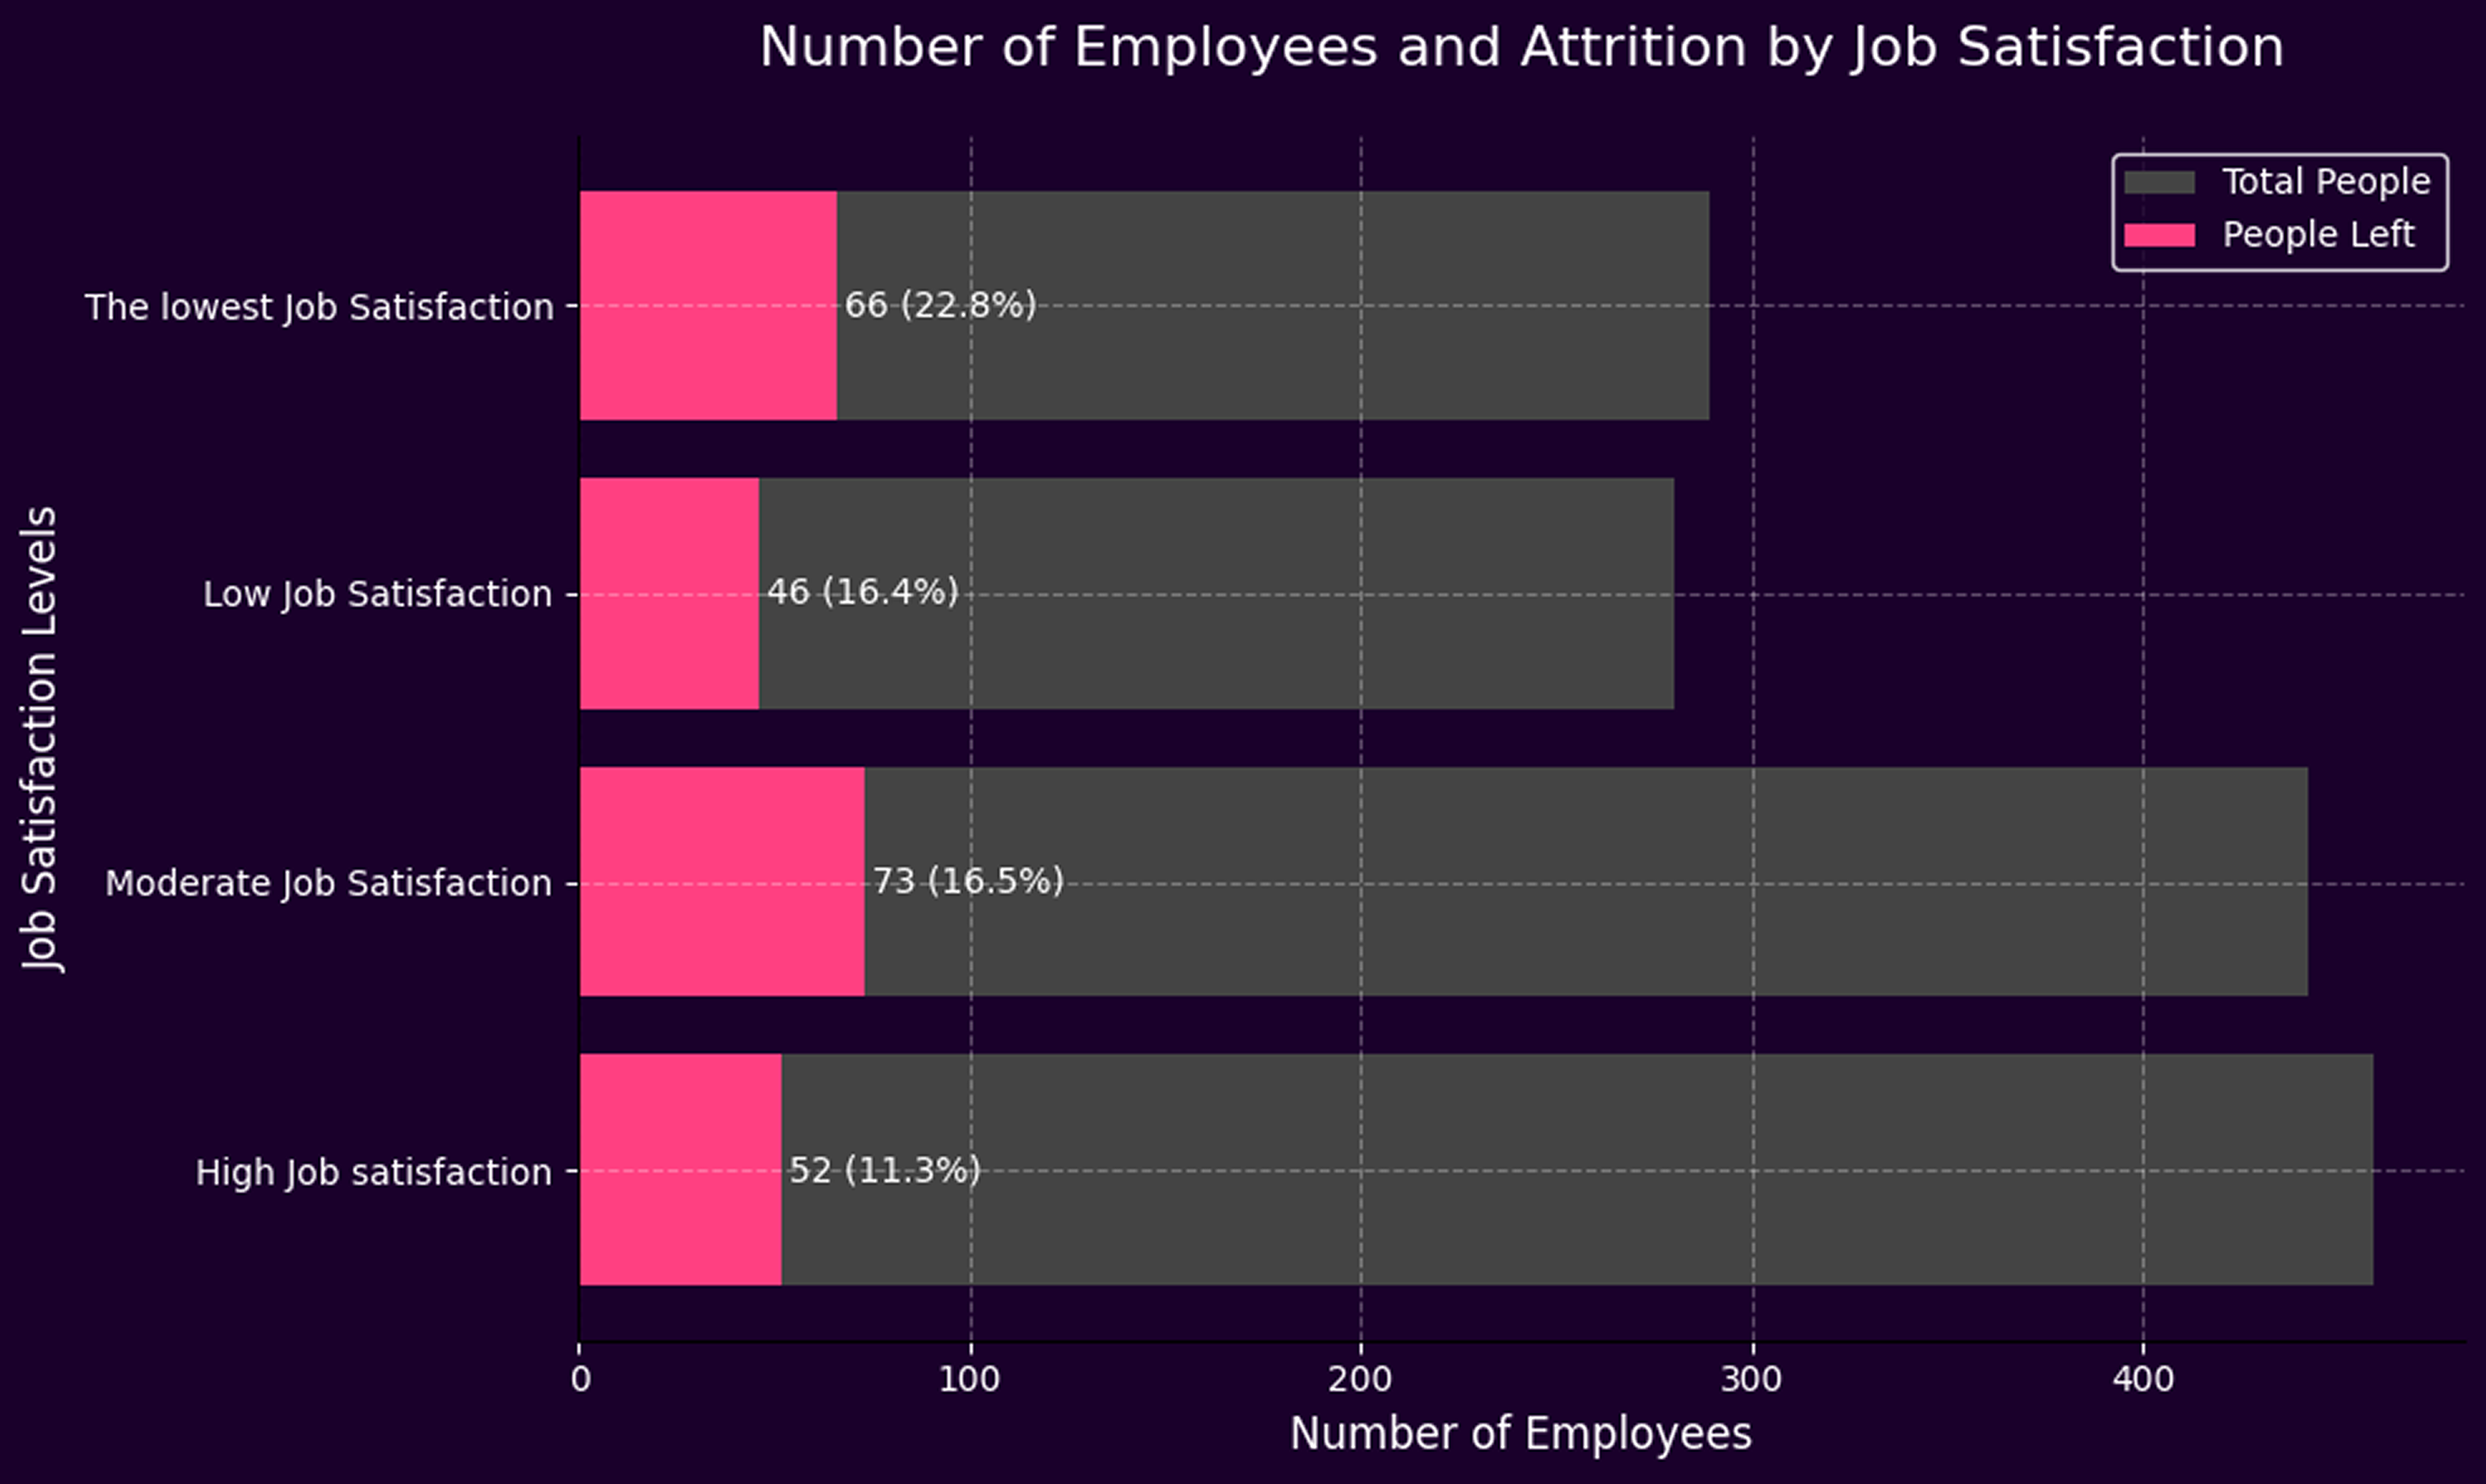
Job satisfaction showed a strong connection with attrition risk. Roughly one-third of employees reported being highly satisfied with their job, and only 11.33% of them ended up leaving the company. In comparison, the attrition rate more than doubled among the most unsatisfied employees, rising to 22.84%. Interestingly, those in the “quite satisfied” and “not so satisfied” categories had nearly equal attrition rates—around 16.5%—suggesting that the biggest retention challenge lies with the most dissatisfied group. These results imply that while boosting employees from moderate to high satisfaction may help, the clearest impact on turnover comes from addressing the drivers of deep dissatisfaction.
Overtime work showed a nuanced relationship with attrition. Among all employees who left the company, 53.59% had worked overtime—only slightly more than the 46.41% who had not. This near-even split suggests that overtime alone may not be a strong predictor of employee departure. However, when analyzing overtime workers specifically, only 30.53% of them left the company, while 69.47% stayed. This indicates that, despite the added workload, most overtime employees remained in their roles, potentially reflecting a higher level of engagement or motivation. Overall, while overtime is often viewed as a stressor, in this case it does not appear to be a dominant factor in driving turnover.
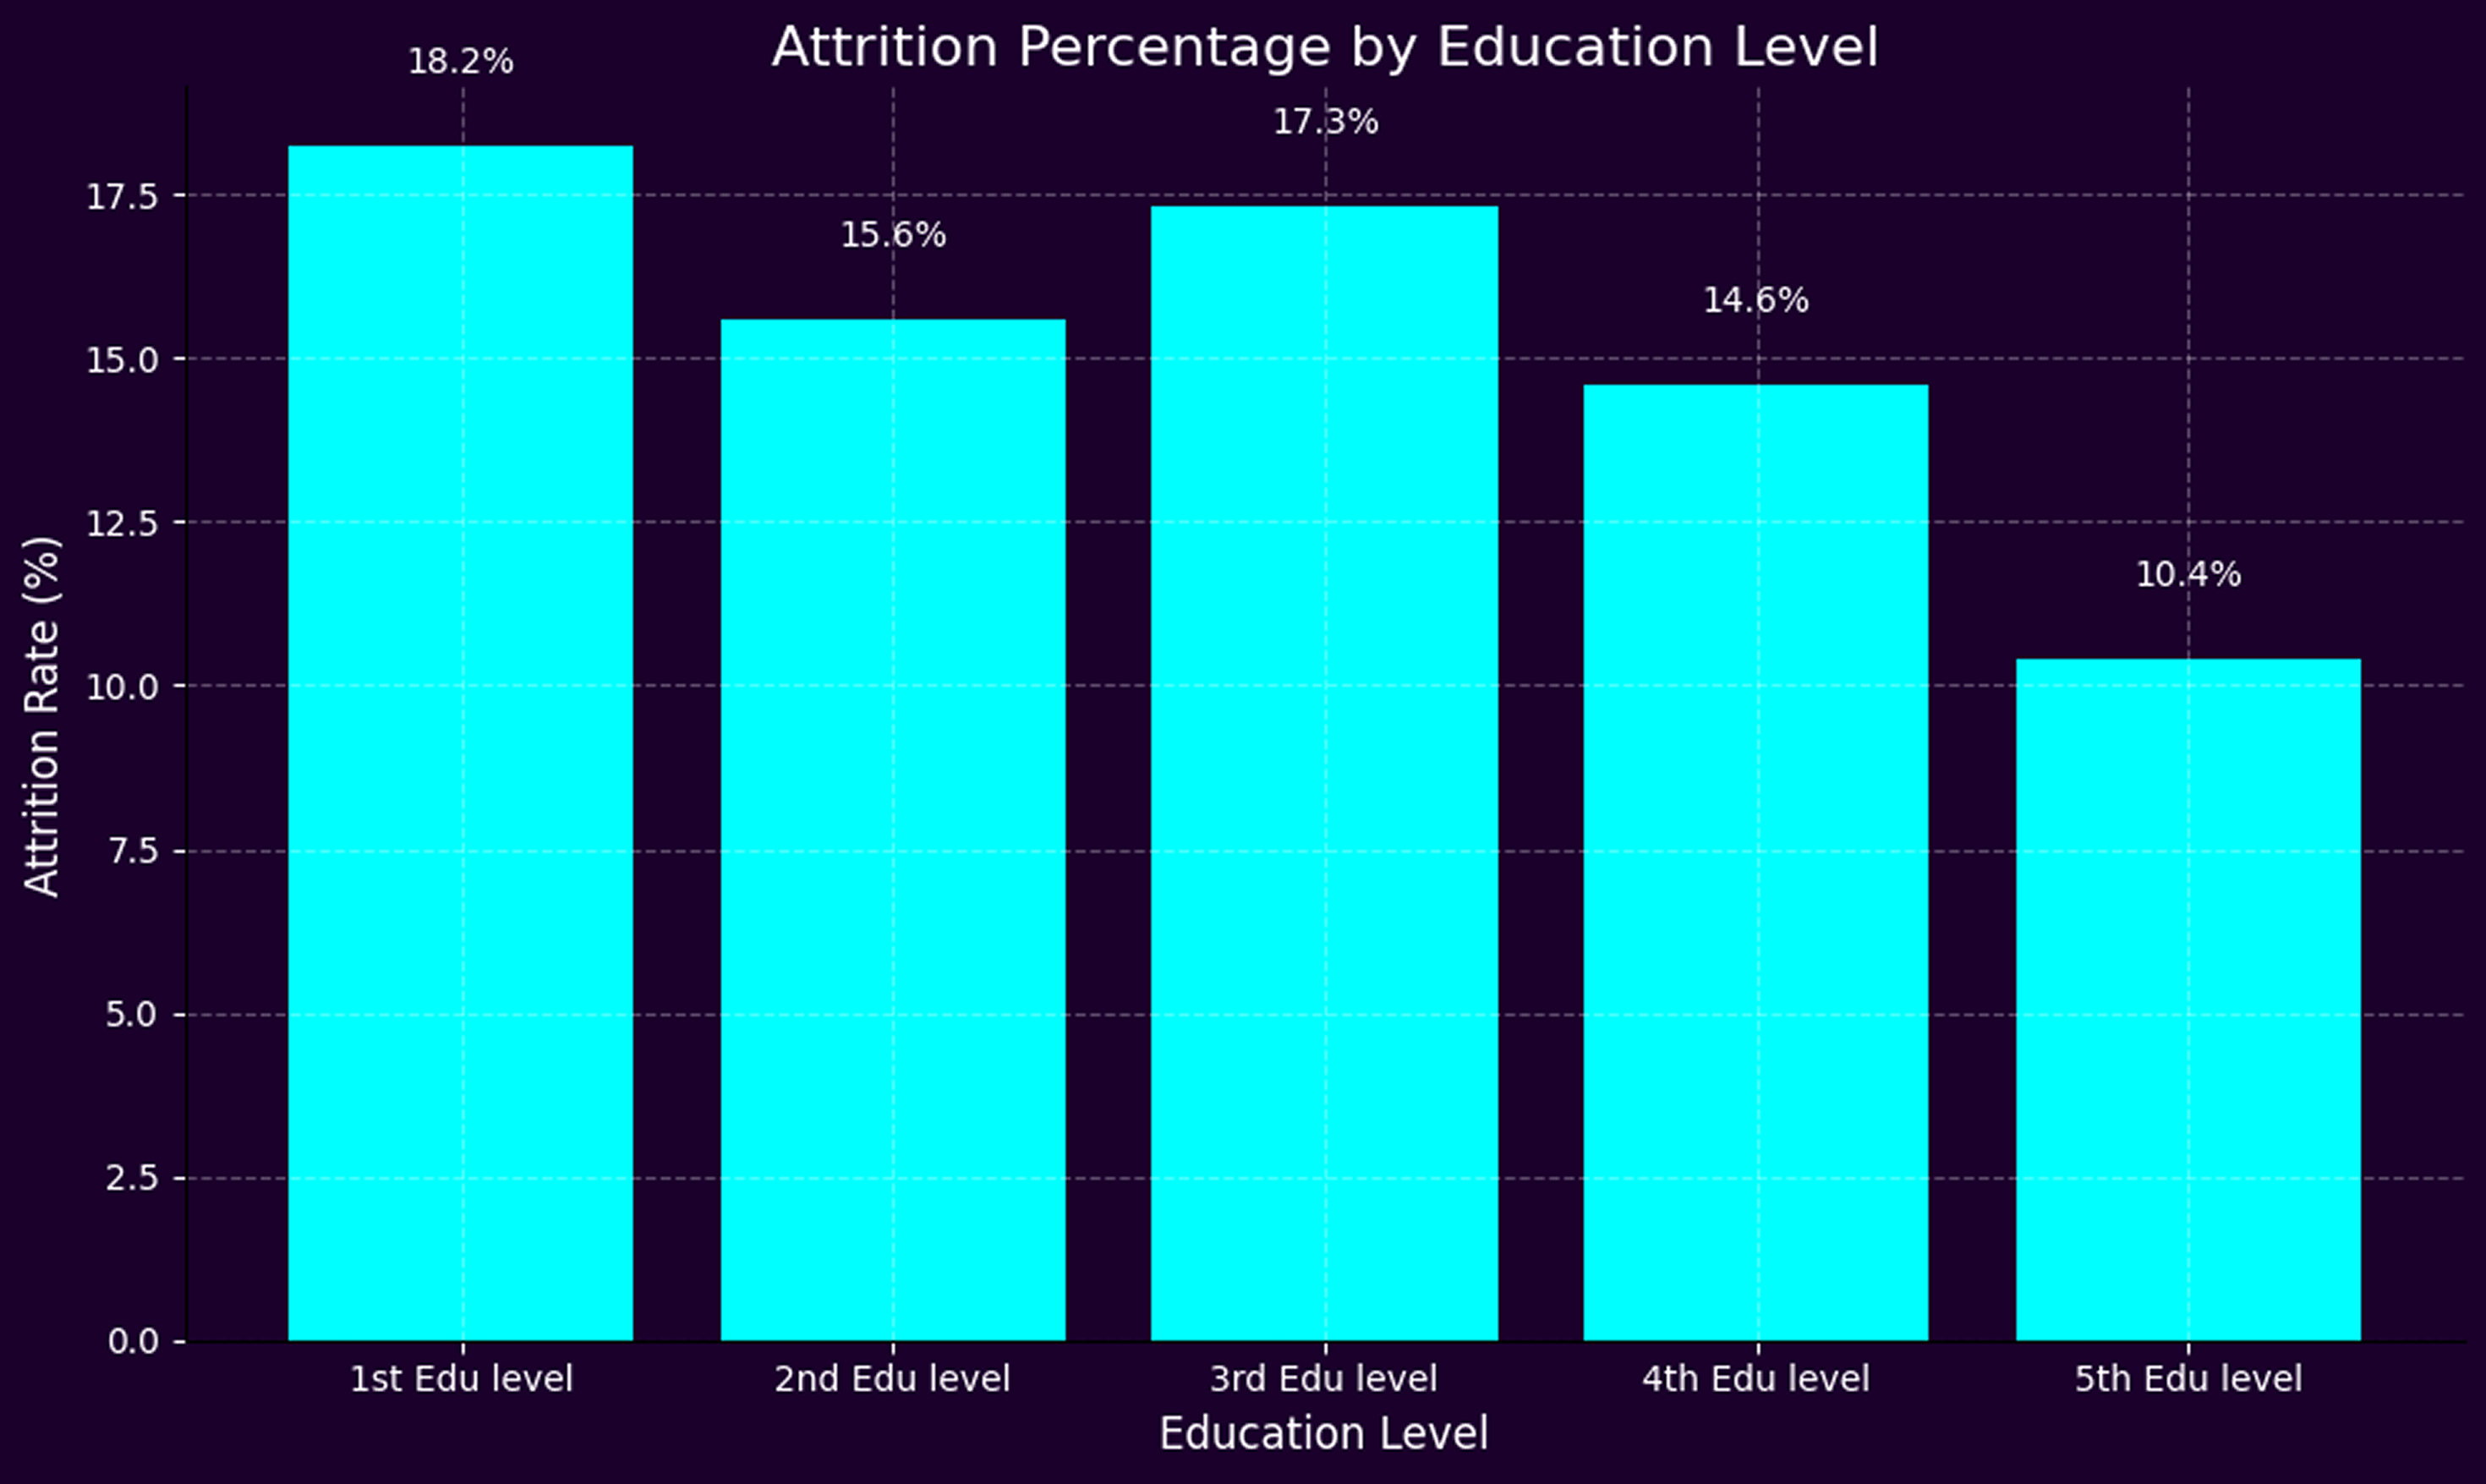
Education level revealed subtle but notable trends in attrition. Although employees with a 3rd-level education made up the largest portion of the workforce (nearly 39%), their attrition rate stood at a moderate 17.3%. Interestingly, the highest attrition rate (18.2%) was observed among those with the lowest education level, despite them comprising only 11.6% of the staff. Conversely, those with the highest education level (5th) not only represented the smallest segment (3.3%) but also showed the lowest attrition rate at just 10.4%. This gradient suggests that higher educational attainment may be loosely associated with greater organizational commitment or better job alignment, though the relationship is not strictly linear.
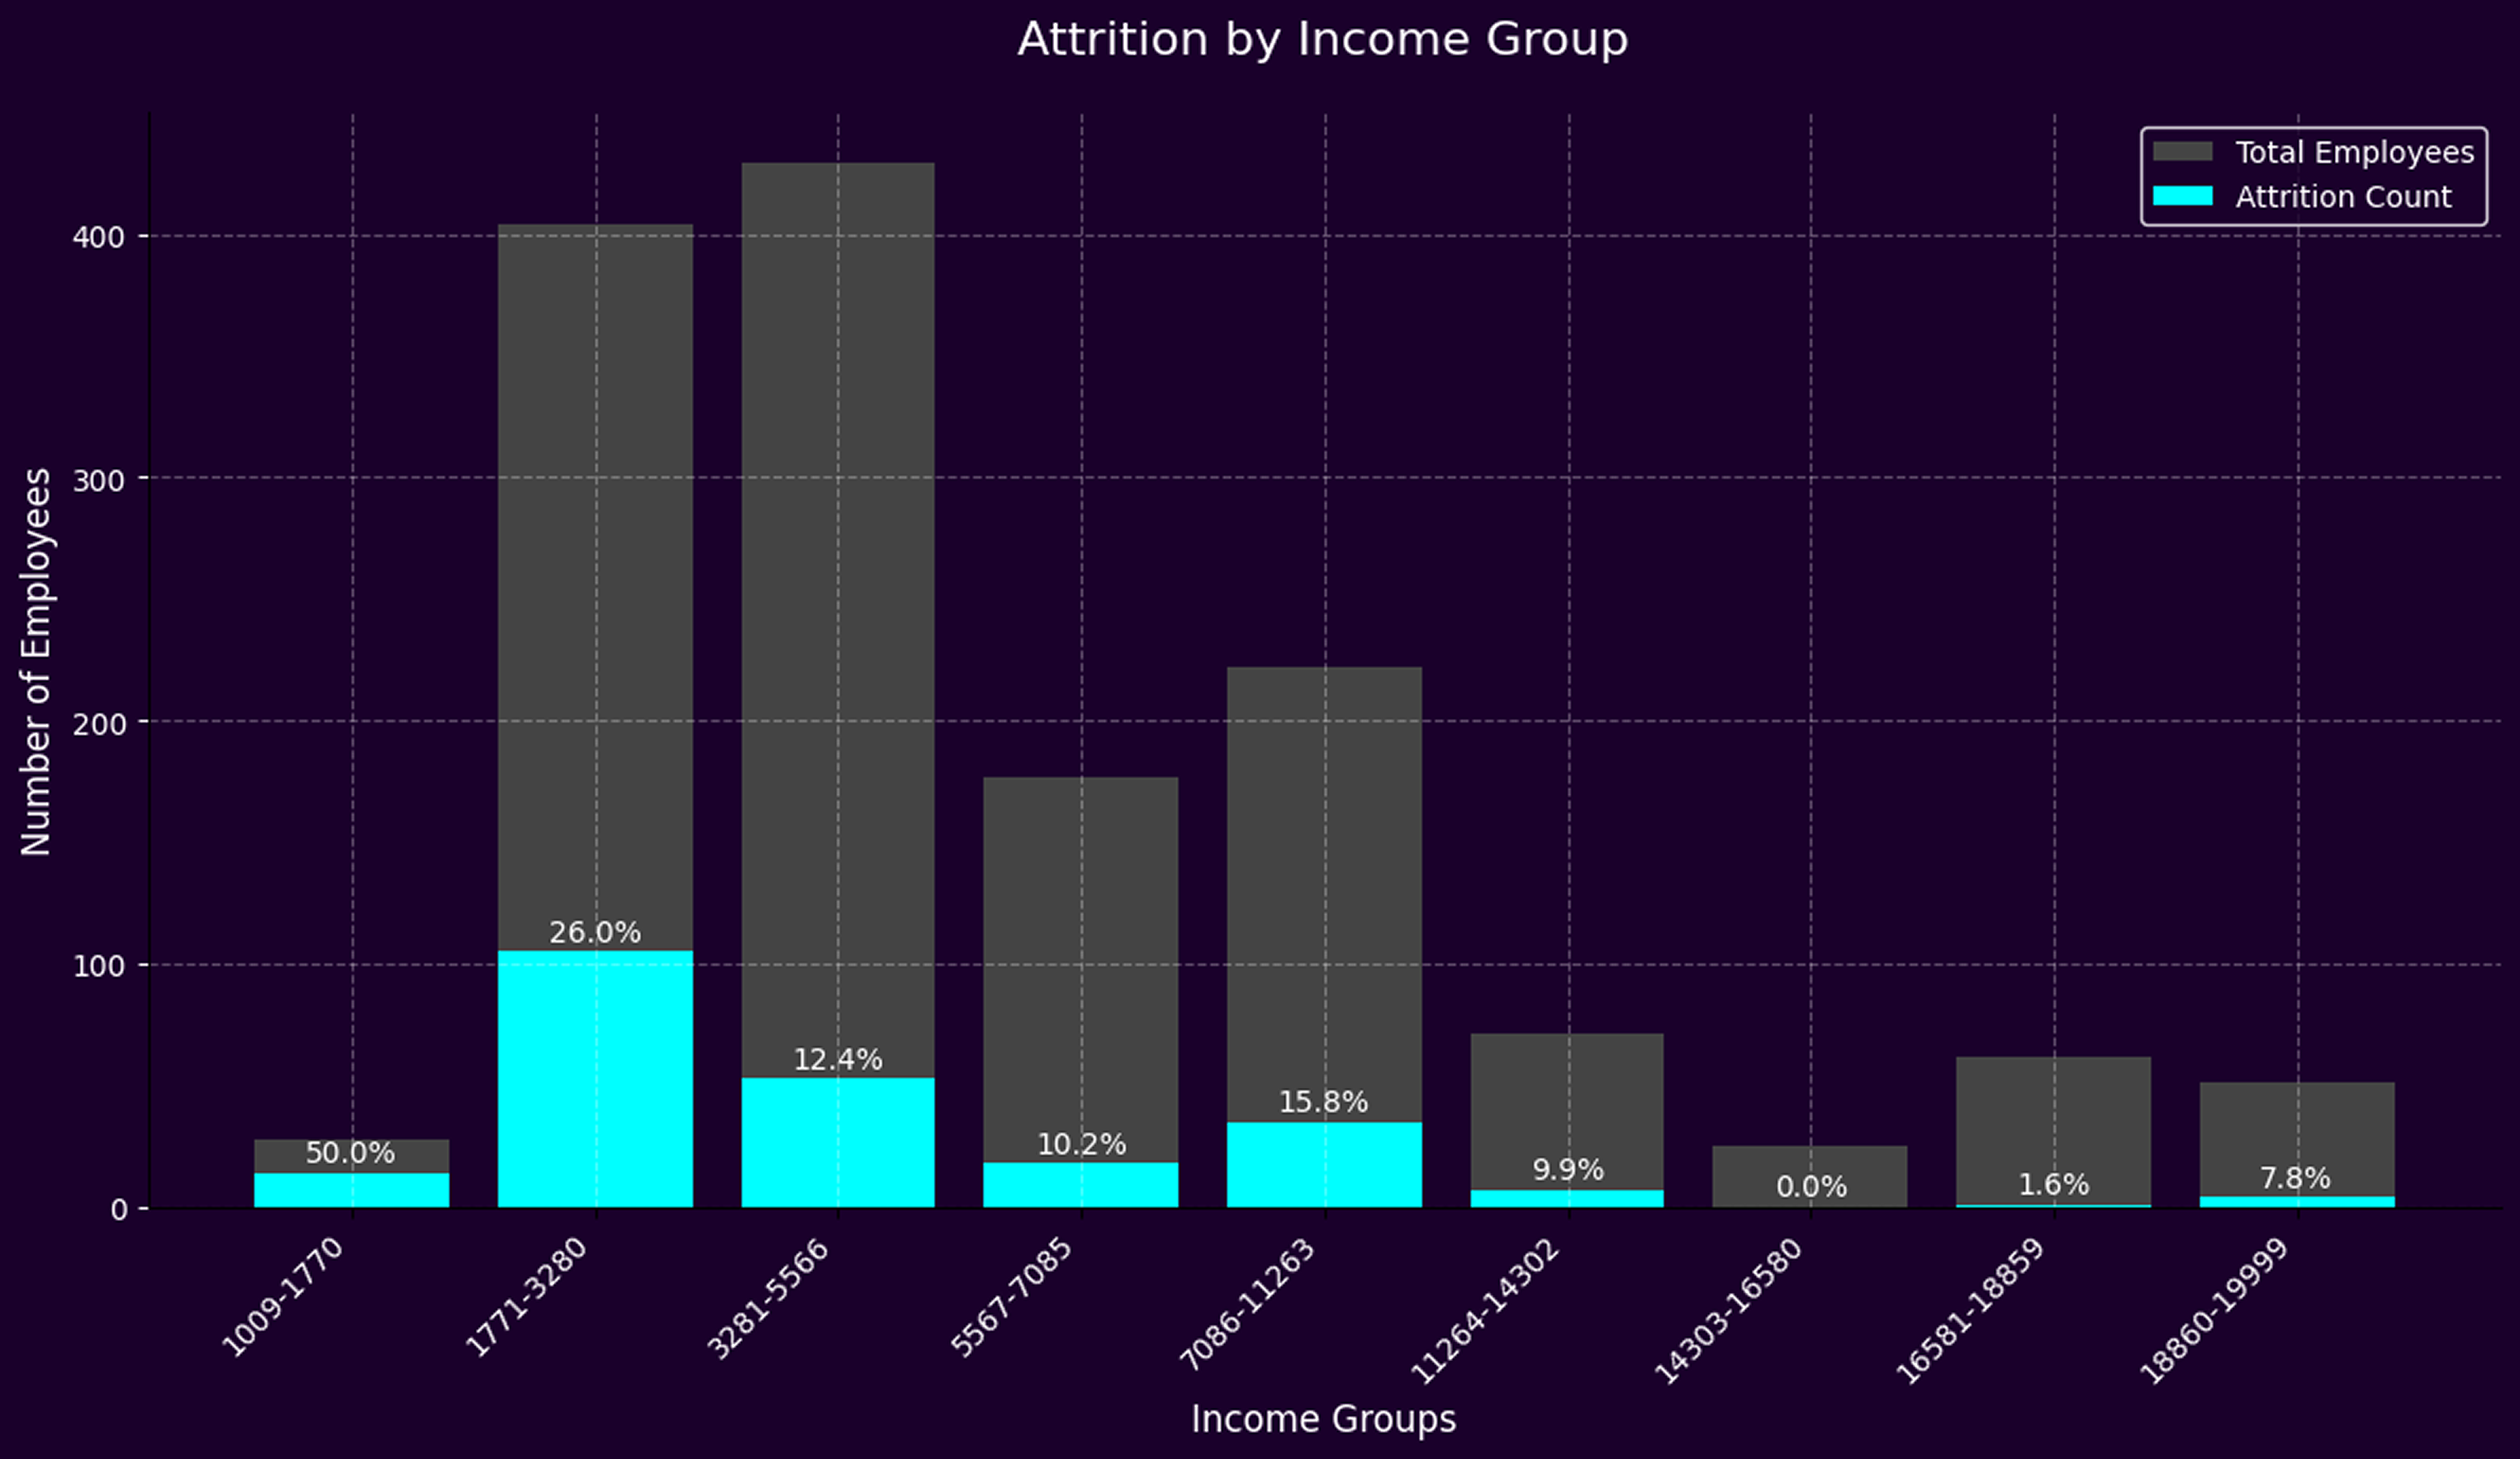
Income level emerged as a powerful predictor of attrition. The data shows a clear inverse relationship between salary and turnover—employees in the lowest income bracket (1st group) had an attrition rate of 50%, while those in the highest brackets (7th–9th groups) had attrition rates near or below 8%, with the 7th group experiencing no attrition at all. Interestingly, nearly 57% of the company’s workforce was concentrated in the 2nd and 3rd income groups, where attrition was still notably elevated at 26% and 12%, respectively. This trend suggests that insufficient compensation—especially in the lower to middle income bands—can significantly impact employee retention, highlighting the importance of competitive and equitable pay structures in minimizing workforce churn.
A unique combination stood out: young, underpaid, and undereducated employees accounted for over 54% of total attrition, indicating a critical vulnerability among early-career, lower-resourced staff.
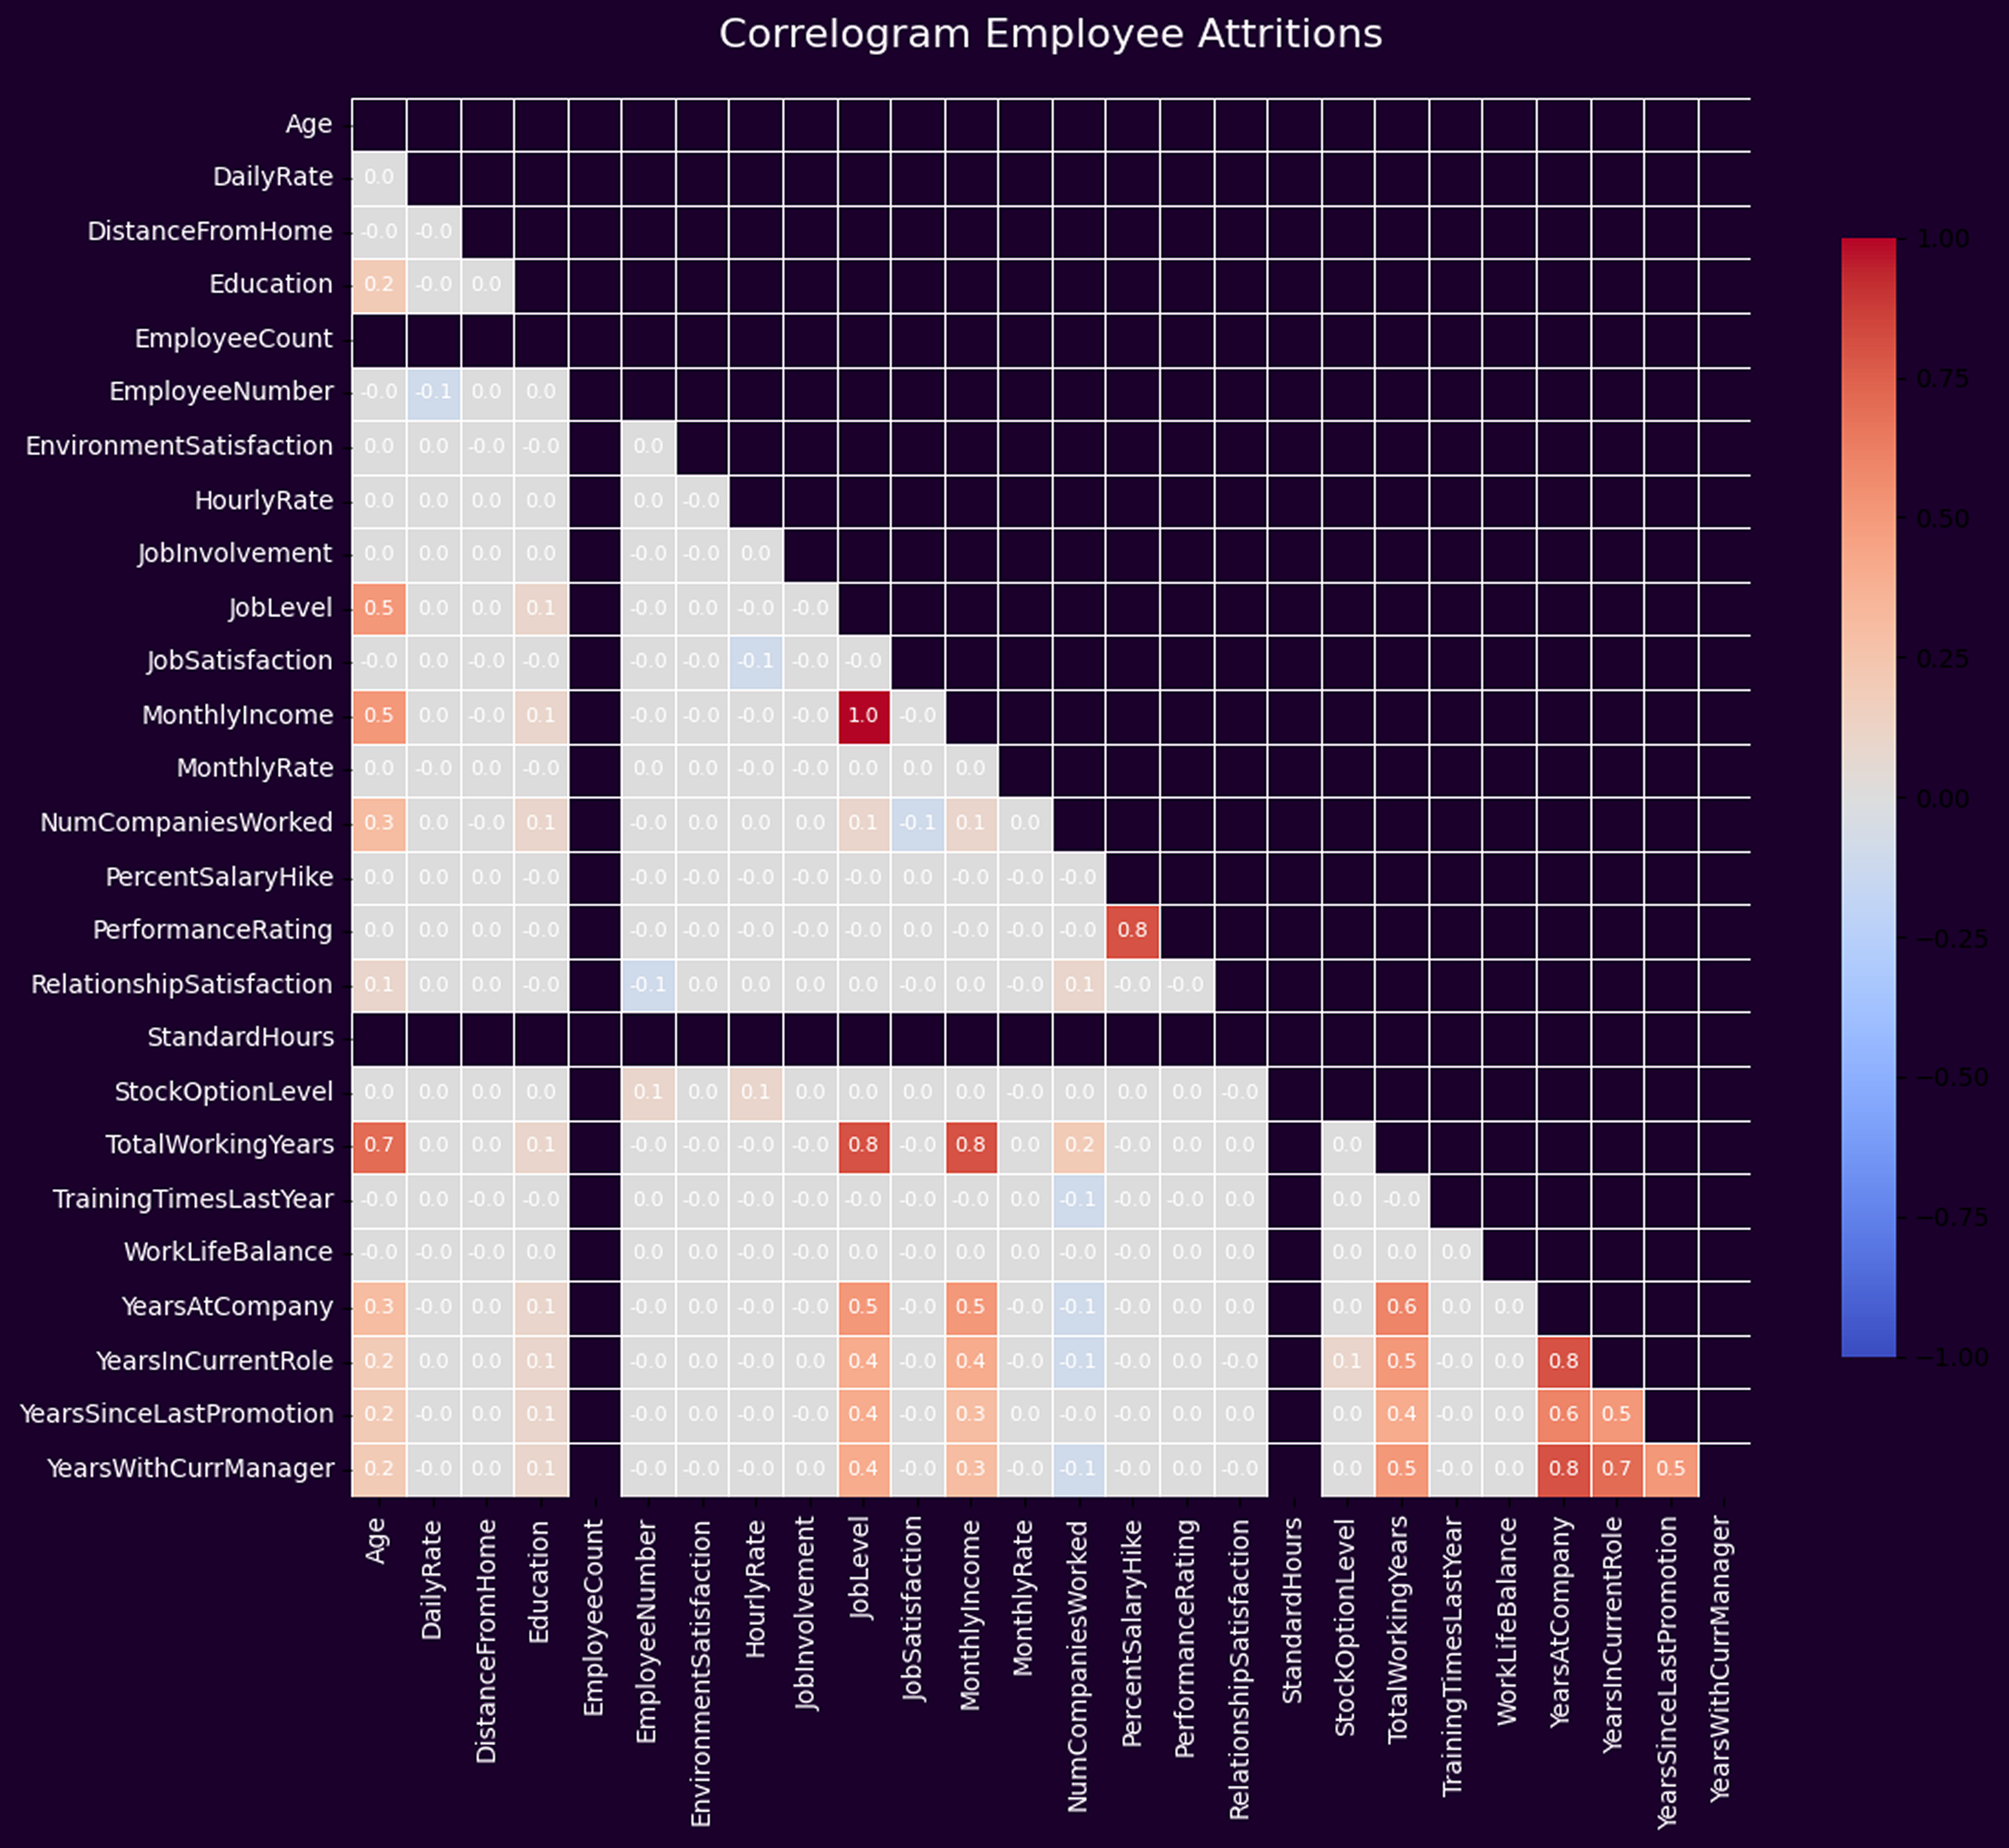
Finally, we generated a correlation heatmap using numerical variables to understand the underlying relationships. This correlogram allowed us to isolate independent predictors of attrition and reduce multicollinearity before building machine learning models. It also reinforced the role of financial and career-stage variables as primary levers in retention.
To better understand what drives employee attrition, we conducted an indicator-level comparison—analyzing key characteristics such as income, age, education, commute distance, job satisfaction, and overtime. The purpose of this analysis was to determine which groups are disproportionately represented among those who left the company, providing a clearer view of the most influential risk factors.
We found that income is the strongest single predictor of attrition. Employees in the lowest income bracket (≤10,504) made up a staggering 93.67% of all leavers. Similarly, being young or having a lower education level also strongly correlated with higher attrition—each contributing over 73% of the departing group.
While job and environment satisfaction still matter, this analysis revealed that even employees reporting higher satisfaction levels made up a sizable portion of those who left. This is likely due to their larger share in the workforce overall. However, dissatisfaction remains a clear risk factor.
This check is important because it helps organizations prioritize intervention. For example, raising job satisfaction may help, but addressing low wages could have a far greater impact on retention. By comparing all indicators side by side, we gain a strategic view of where the real turnover risks lie.
To refine our understanding of attrition drivers, we conducted a correlation analysis of all numerical variables using a correlogram. This helped identify whether any variables strongly overlapped and might distort or duplicate insights during modeling. Most correlations were relatively weak, suggesting that key attrition factors tend to act independently rather than in tandem.
However, a few notable patterns emerged. For example, Monthly Income was strongly correlated with Job Level and Total Working Years, which makes intuitive sense: higher seniority and experience typically bring higher compensation. Similarly, Years at Company, Years in Current Role, and Years with Current Manager were moderately interrelated, indicating tenure-driven progression structures. Importantly, none of these relationships were strong enough to cause multicollinearity concerns, meaning we could preserve these features for modeling without overfitting risks. This step ensured that our final model would reflect genuine, distinct influences on attrition behavior.
To deepen our understanding of which features most influence employee attrition, we applied an XGBoost classification model and extracted feature importances from it. While the earlier “importance of indicators check” focused on analyzing individual features in isolation—such as how many young employees left or how satisfaction levels impacted attrition—this machine learning–based approach evaluates the predictive power of all variables together in the context of a model trained to detect patterns in the data.
The results showed that Monthly Income was by far the most impactful feature in predicting whether an employee would leave, followed by factors like whether the employee worked overtime, Daily Rate, and Age. Other influential variables included number of companies worked, years at company, and various satisfaction metrics. This reinforces many of the findings from our earlier analysis but adds a new layer of confidence by accounting for interactions between features.
Using this model-based method is crucial because it reveals which variables actually contribute to accurate predictions—not just correlations. This helps HR teams prioritize factors that matter most in forecasting attrition and designing retention strategies. For instance, while some satisfaction indicators may seem intuitive, their relatively lower importance in the model suggests that compensation and workload (e.g., income and overtime) may need to be addressed first in practical interventions.
This analysis, while based on open-source data, mirrors the methodology we apply with real-world clients. By combining domain expertise, business context, and machine learning, we translated employee data into actionable insights.
Several factors emerged as strong predictors of attrition: lower income, younger age, limited education, and long commutes. Environmental and job satisfaction played a clear role, with dissatisfaction significantly raising the likelihood of departure. Interestingly, those working overtime — often seen as a red flag — were actually less likely to leave, possibly indicating higher engagement or access to additional compensation.
For this hypothetical organization, we would recommend improving compensation for lower-income groups, investing in early-career development, and understanding the root causes of dissatisfaction. Even subtle operational shifts, when guided by data, can reduce attrition risk and strengthen culture.
The takeaway: Organizations that invest in internal analytics are better equipped to retain talent and improve morale. Whylitics makes those capabilities accessible and scalable.
You can explore the full research, including the predictive machine learning model, on Google Colab here.