Exploring customer segment patterns to optimize marketing strategies and revenue growth.
This article demonstrates our customer behavior analysis approach using a public retail dataset to protect client confidentiality.
In today’s highly competitive marketplace, understanding customer behavior is essential for driving growth, improving customer loyalty, and making data-driven business decisions. As part of our commitment to delivering actionable insights for retail and e-commerce businesses, we conducted a comprehensive customer behavior analysis using publicly available transaction data sourced from Kaggle’s, open-source e-commerce dataset.
Although the dataset does not specify the exact products sold, it offers rich contextual information — including customer location, age, gender, satisfaction level, and purchase history. By leveraging this information, we are able to uncover meaningful patterns in spending, purchasing frequency, and segment-level behaviors. Our objective was to demonstrate how even limited, anonymized data can be transformed into valuable business intelligence, revealing the drivers of revenue and customer engagement across different demographic and behavioral segments.
This dataset captures customer demographics, transactional behavior, and satisfaction levels within an e-commerce environment. While product details are unavailable, the data provides rich context for analyzing spending patterns, engagement, and retention across different customer segments.
Our dataset includes customers from six cities. While New York has the largest customer base (59 customers compared to 58 from each other city), San Francisco leads in total spending. This indicates that customer volume does not necessarily drive revenue — certain cities can yield higher returns per customer. Focused marketing in San Francisco could further capitalize on its high-spending profile, while strategies in New York might aim to increase average spend per customer.
The dataset shows an equal number of male and female customers. However, male customers spent $49,543.6 more and purchased 644 more items than females. Males also reported higher satisfaction levels, while females had a higher proportion of unsatisfied responses. This suggests that targeting initiatives toward improving the female customer experience could both boost satisfaction and close the revenue gap.
The most represented age is 30, yet 24-year-old customers spend and purchase more on a per-person basis. The overall age range is 28–42, indicating that the customer base is concentrated in mid-adulthood with no representation of younger or older demographics. Without product information, it’s unclear whether campaigns could attract significantly younger or older audiences, but the current data suggests potential in further engaging high-value age groups like 24-year-olds.
Membership distribution is nearly equal across Gold, Silver, and Bronze tiers. Nevertheless, Gold members generate higher spending, confirming the value of premium membership benefits. Strengthening Gold-tier perks or encouraging upgrades from Silver and Bronze could drive incremental revenue.
Purchases are almost evenly split between customers buying with a discount (174) and without (175). Interestingly, non-discount purchases result in higher spending and more items sold. This challenges the common assumption that discounts directly boost sales volume, suggesting that discount strategies should be evaluated for profitability impact.
Satisfied customers (125) account for the largest group and also spend the most. However, the presence of 116 unsatisfied and 107 neutral customers signals substantial room for improvement. Enhancing product or service quality could shift neutral or unsatisfied customers into the satisfied category, with likely revenue gains.
This analysis highlights the strategic value of customer behavior research in shaping revenue growth, improving satisfaction, and refining market targeting. Even in the absence of product-level data, we uncovered patterns in spending, engagement, and loyalty that directly inform marketing, pricing, and retention strategies.
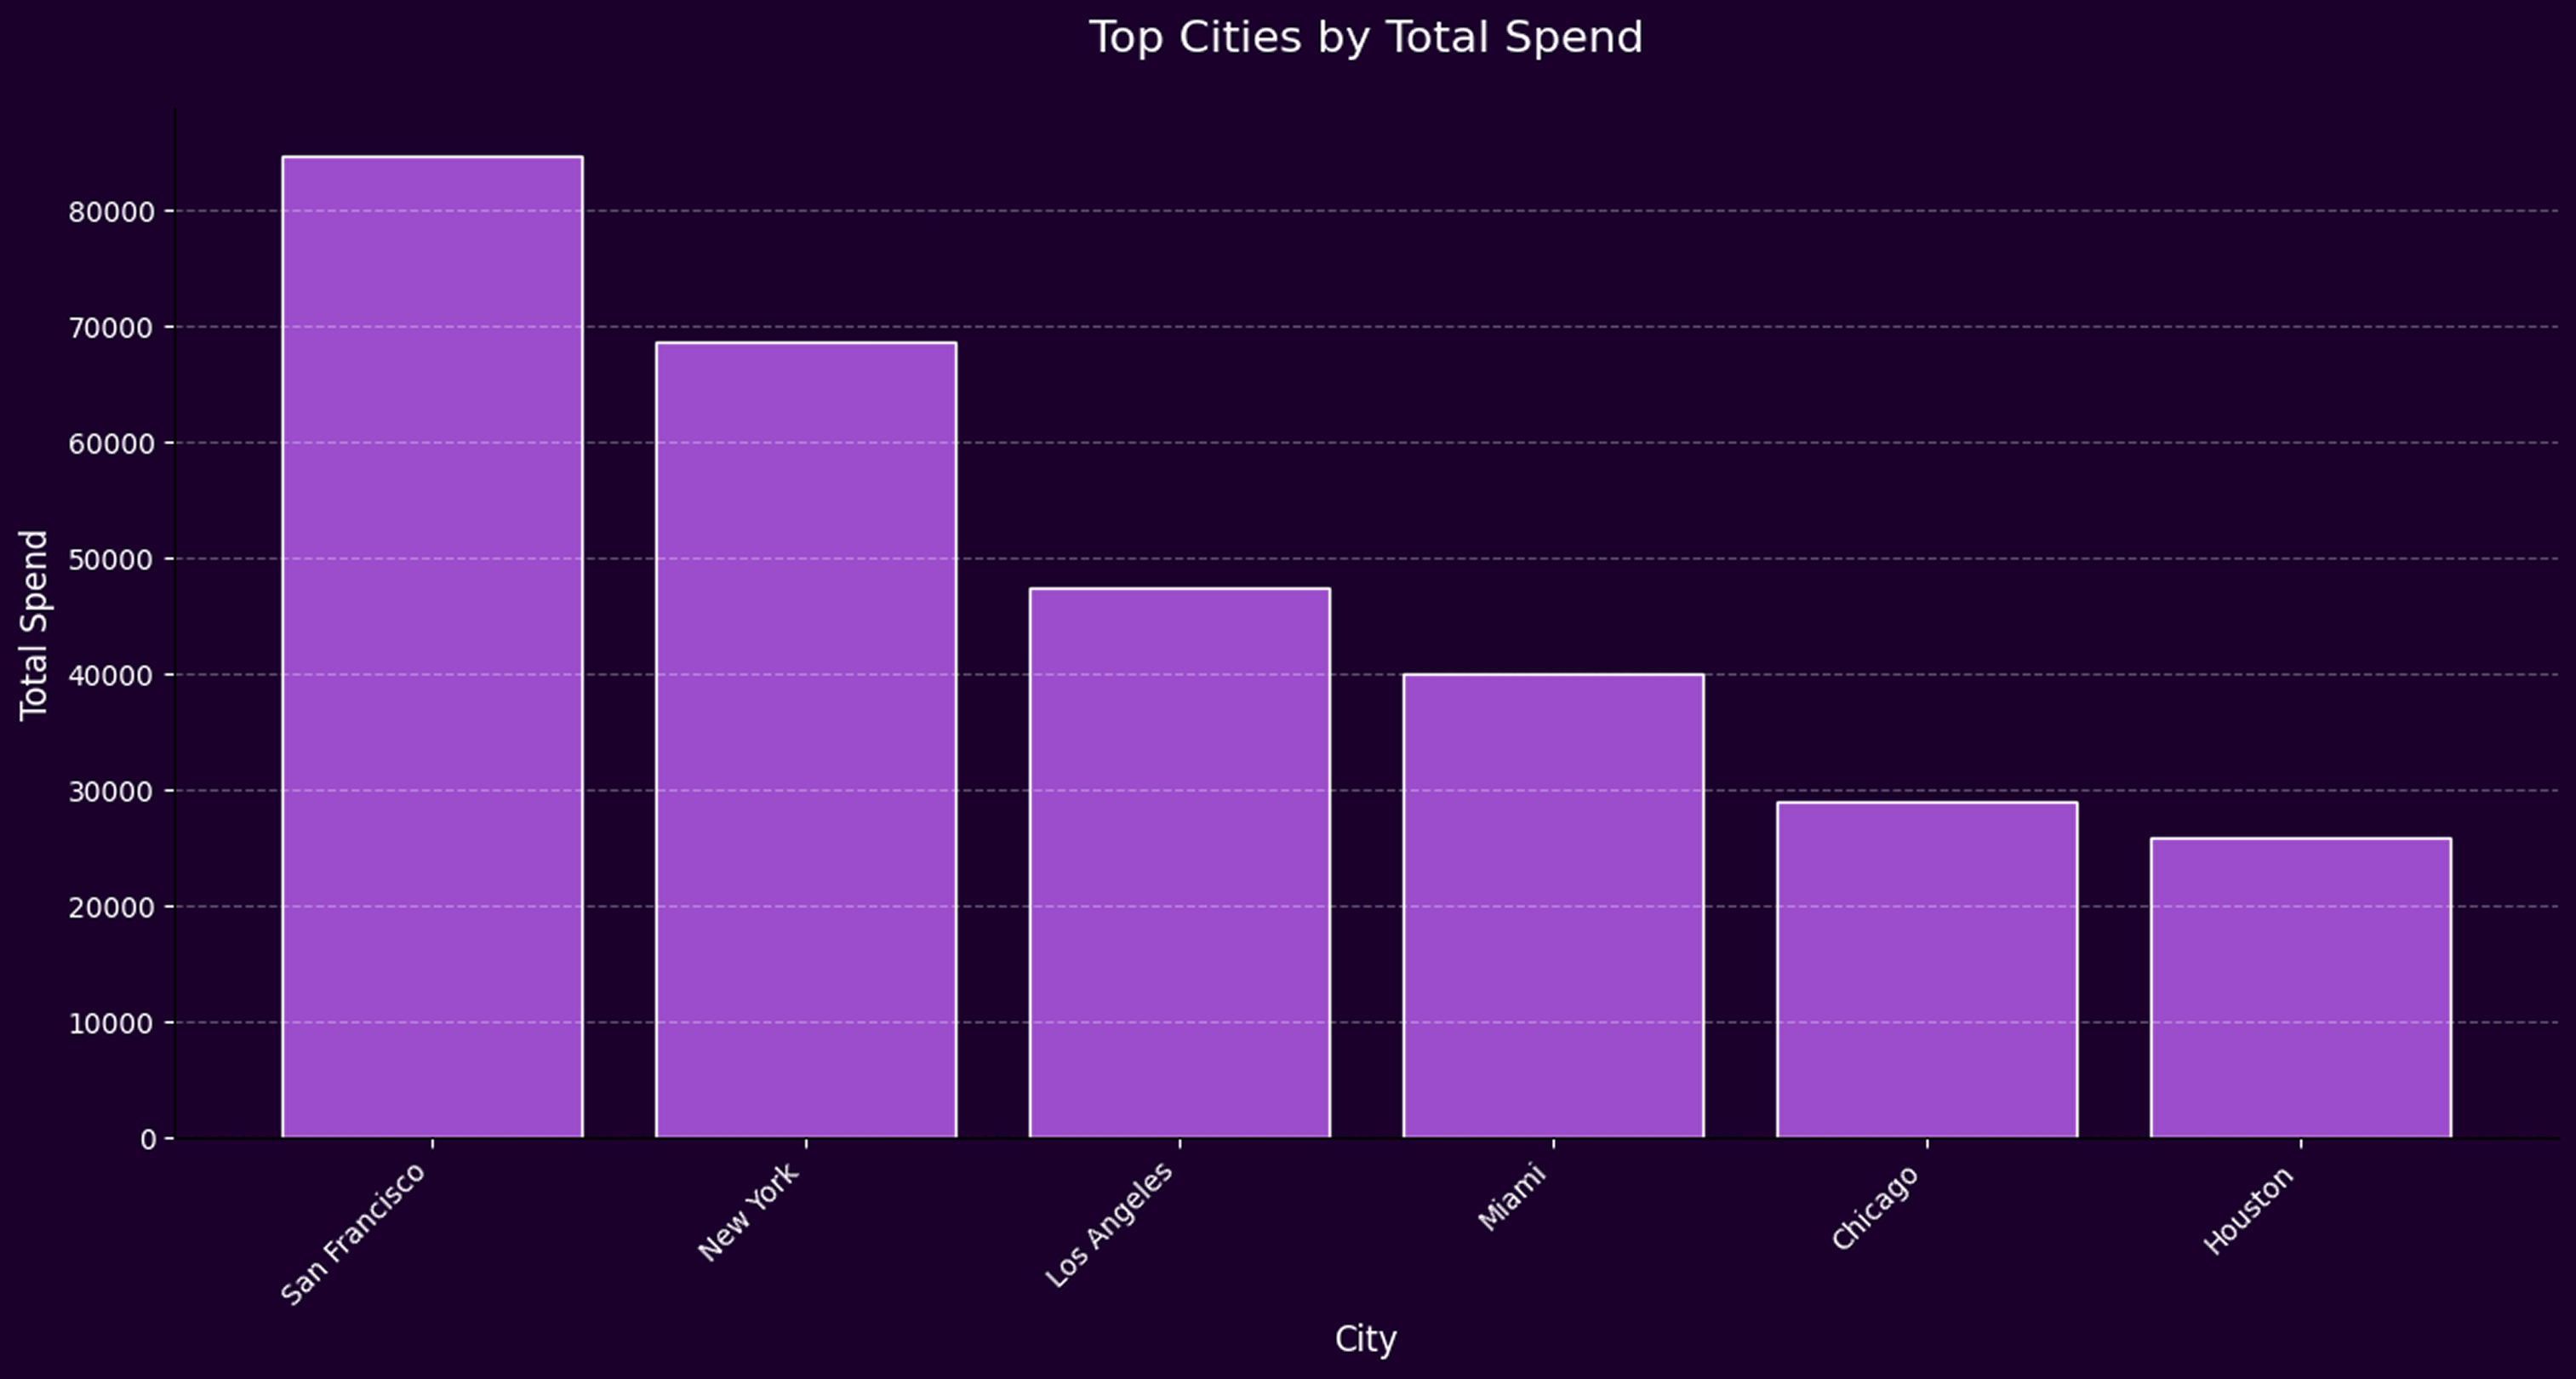
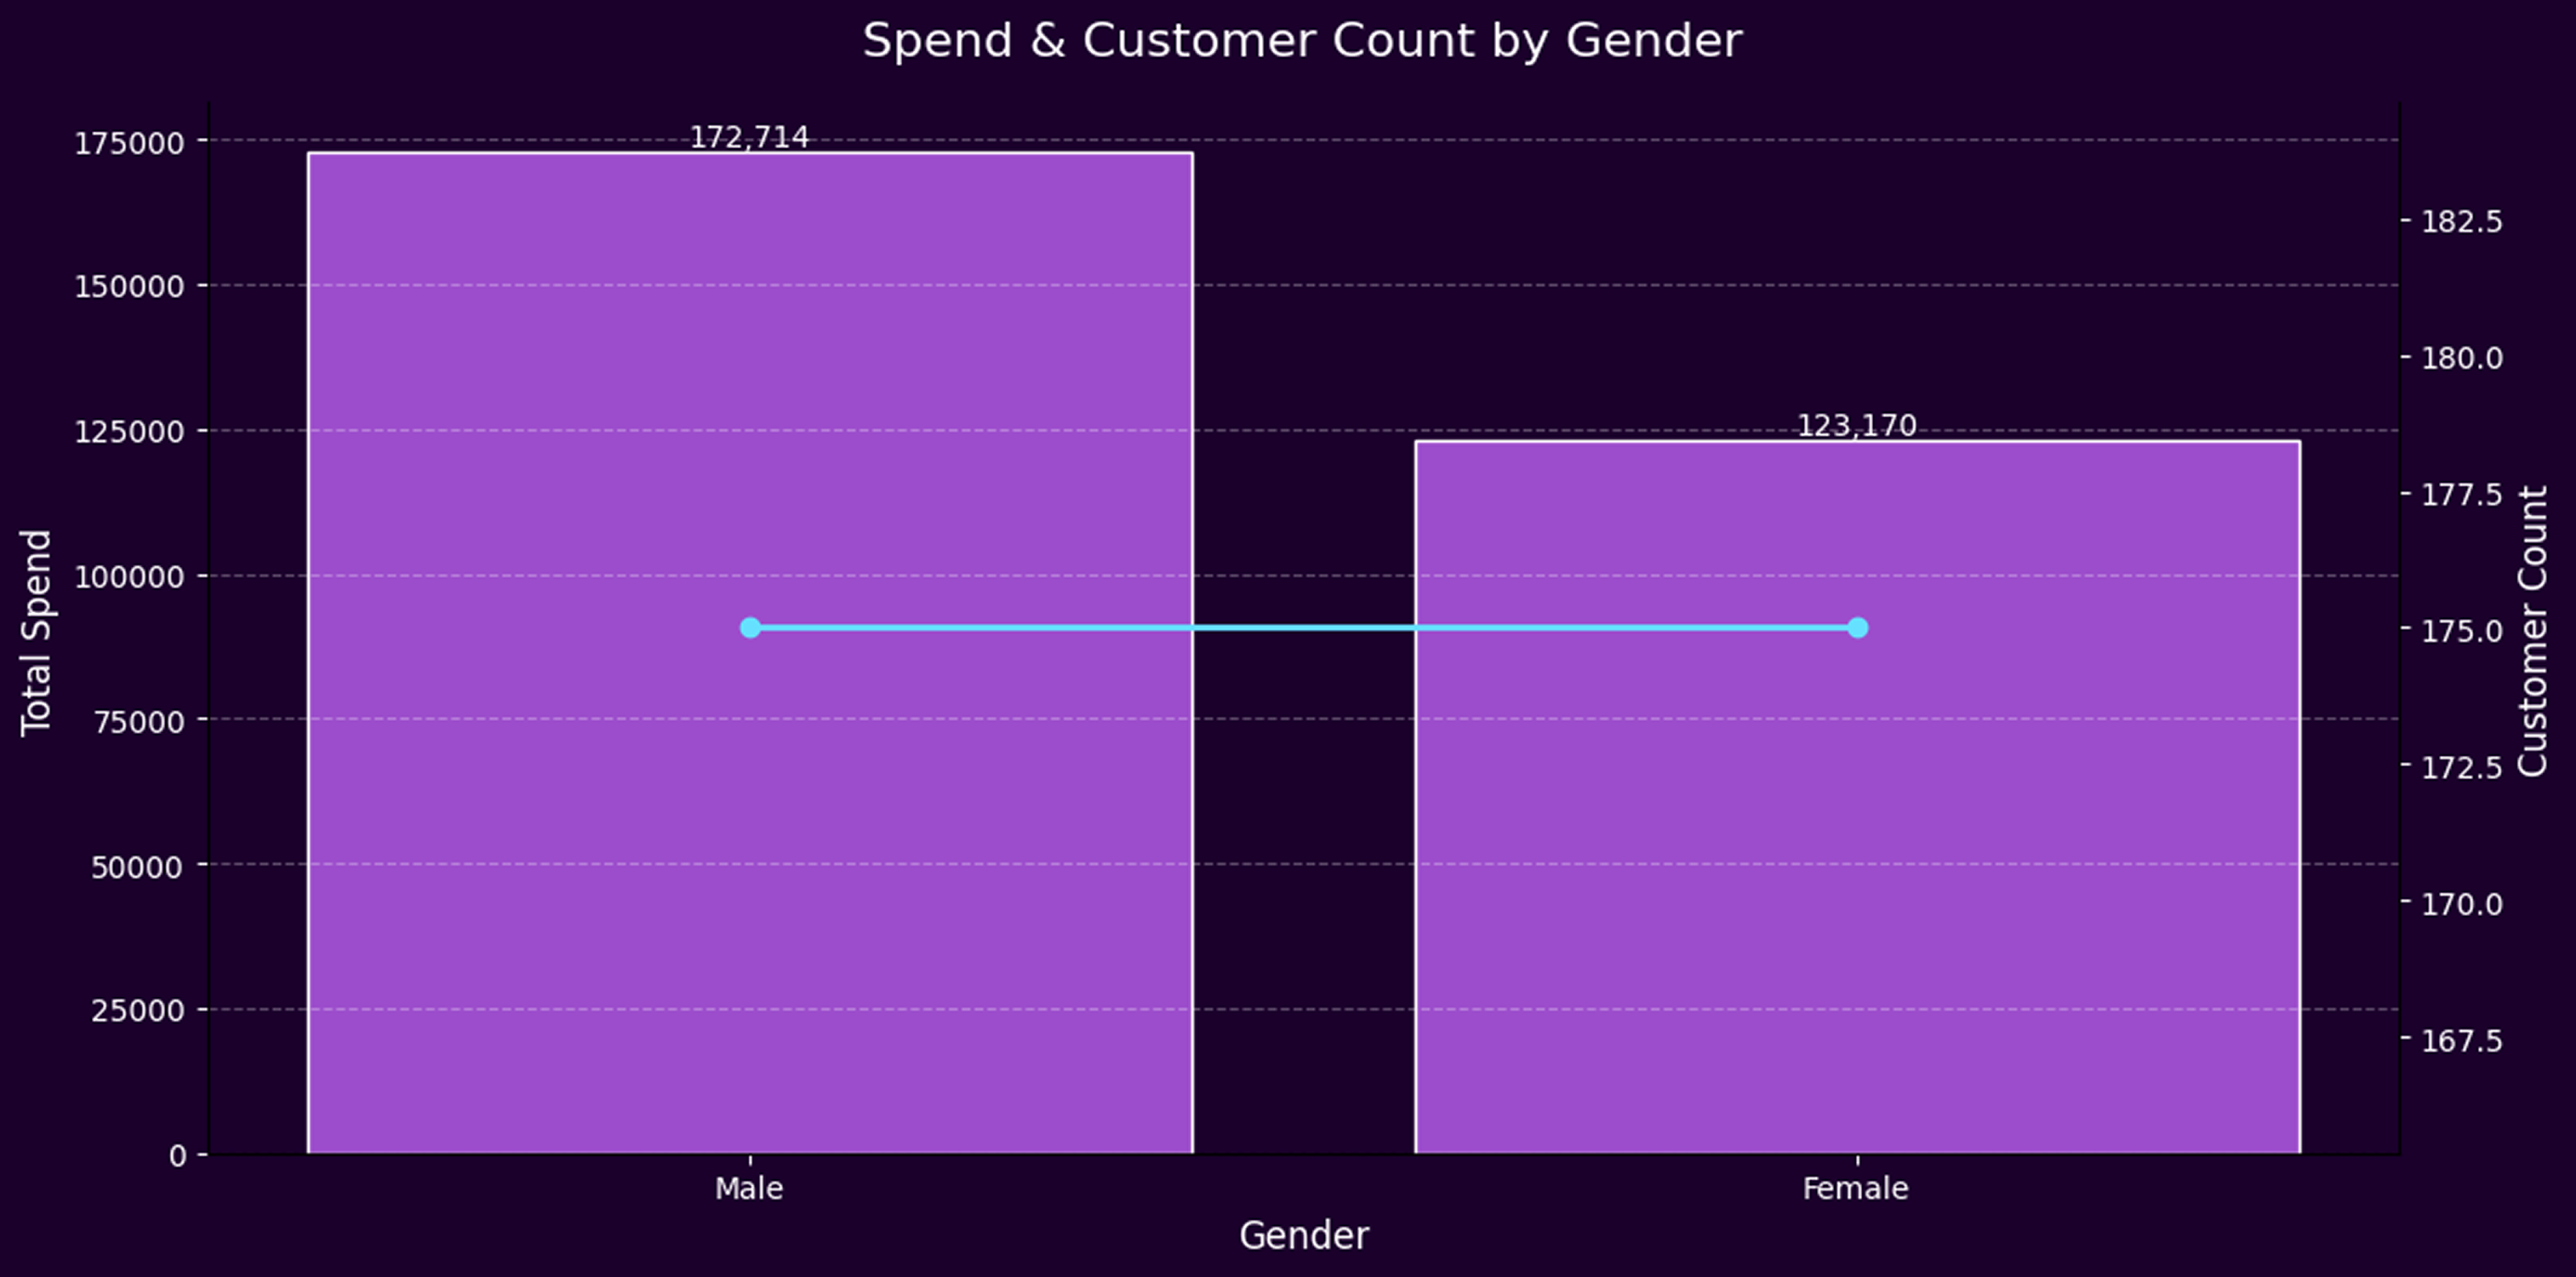
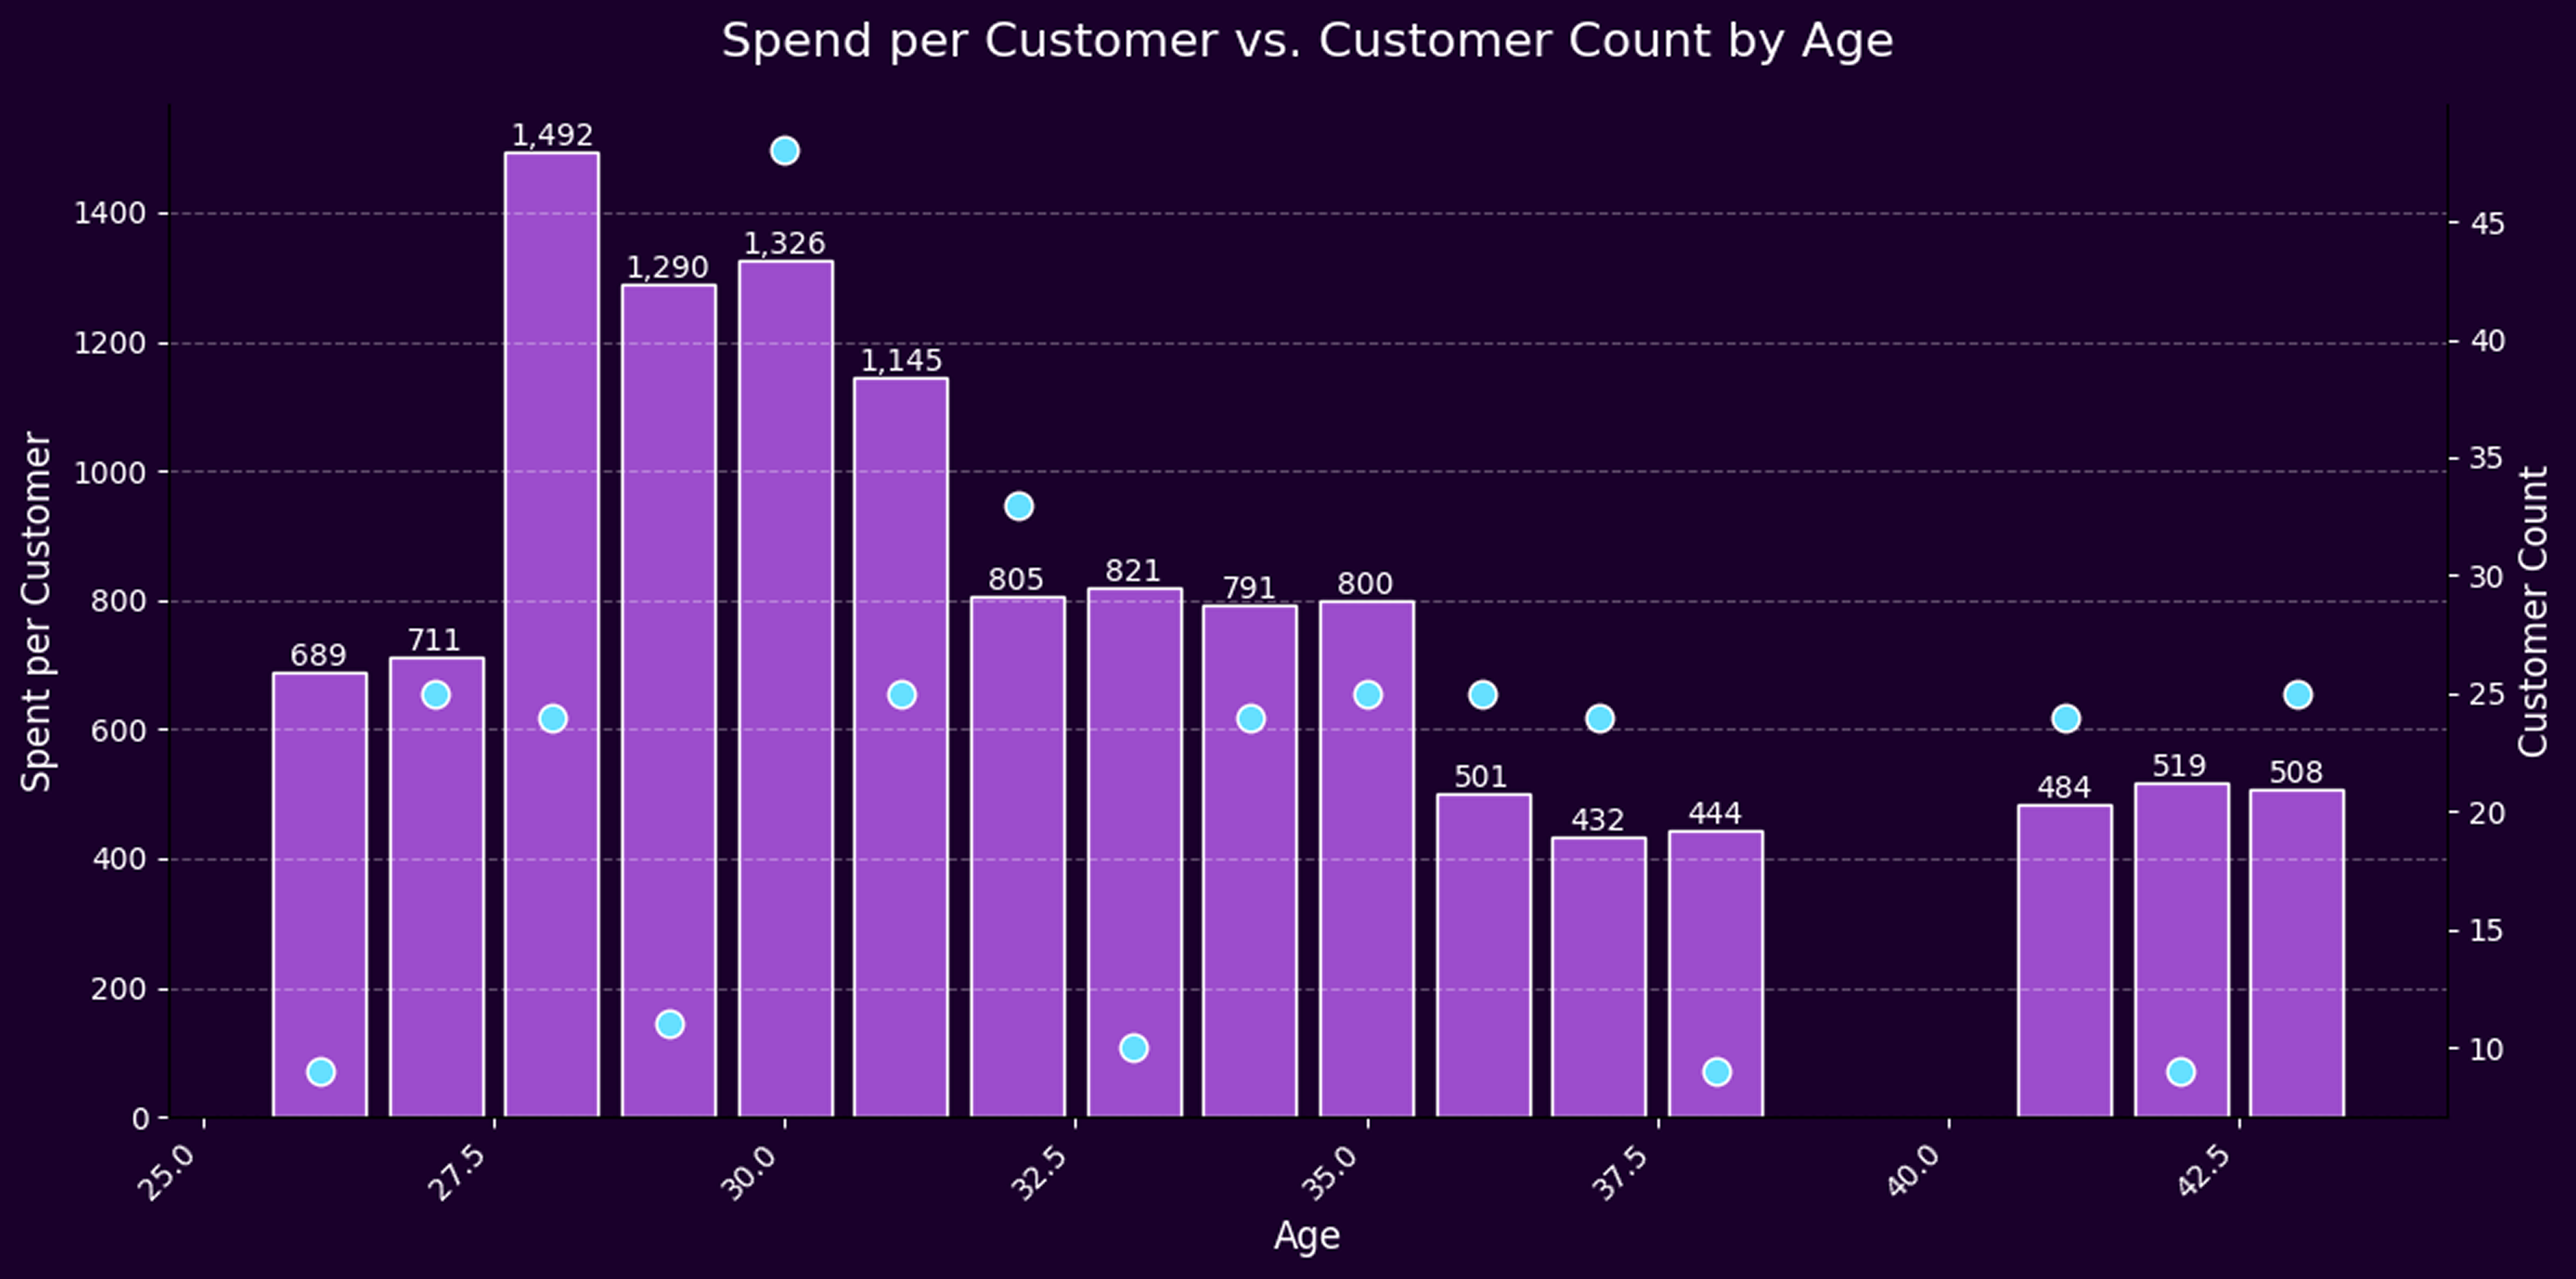
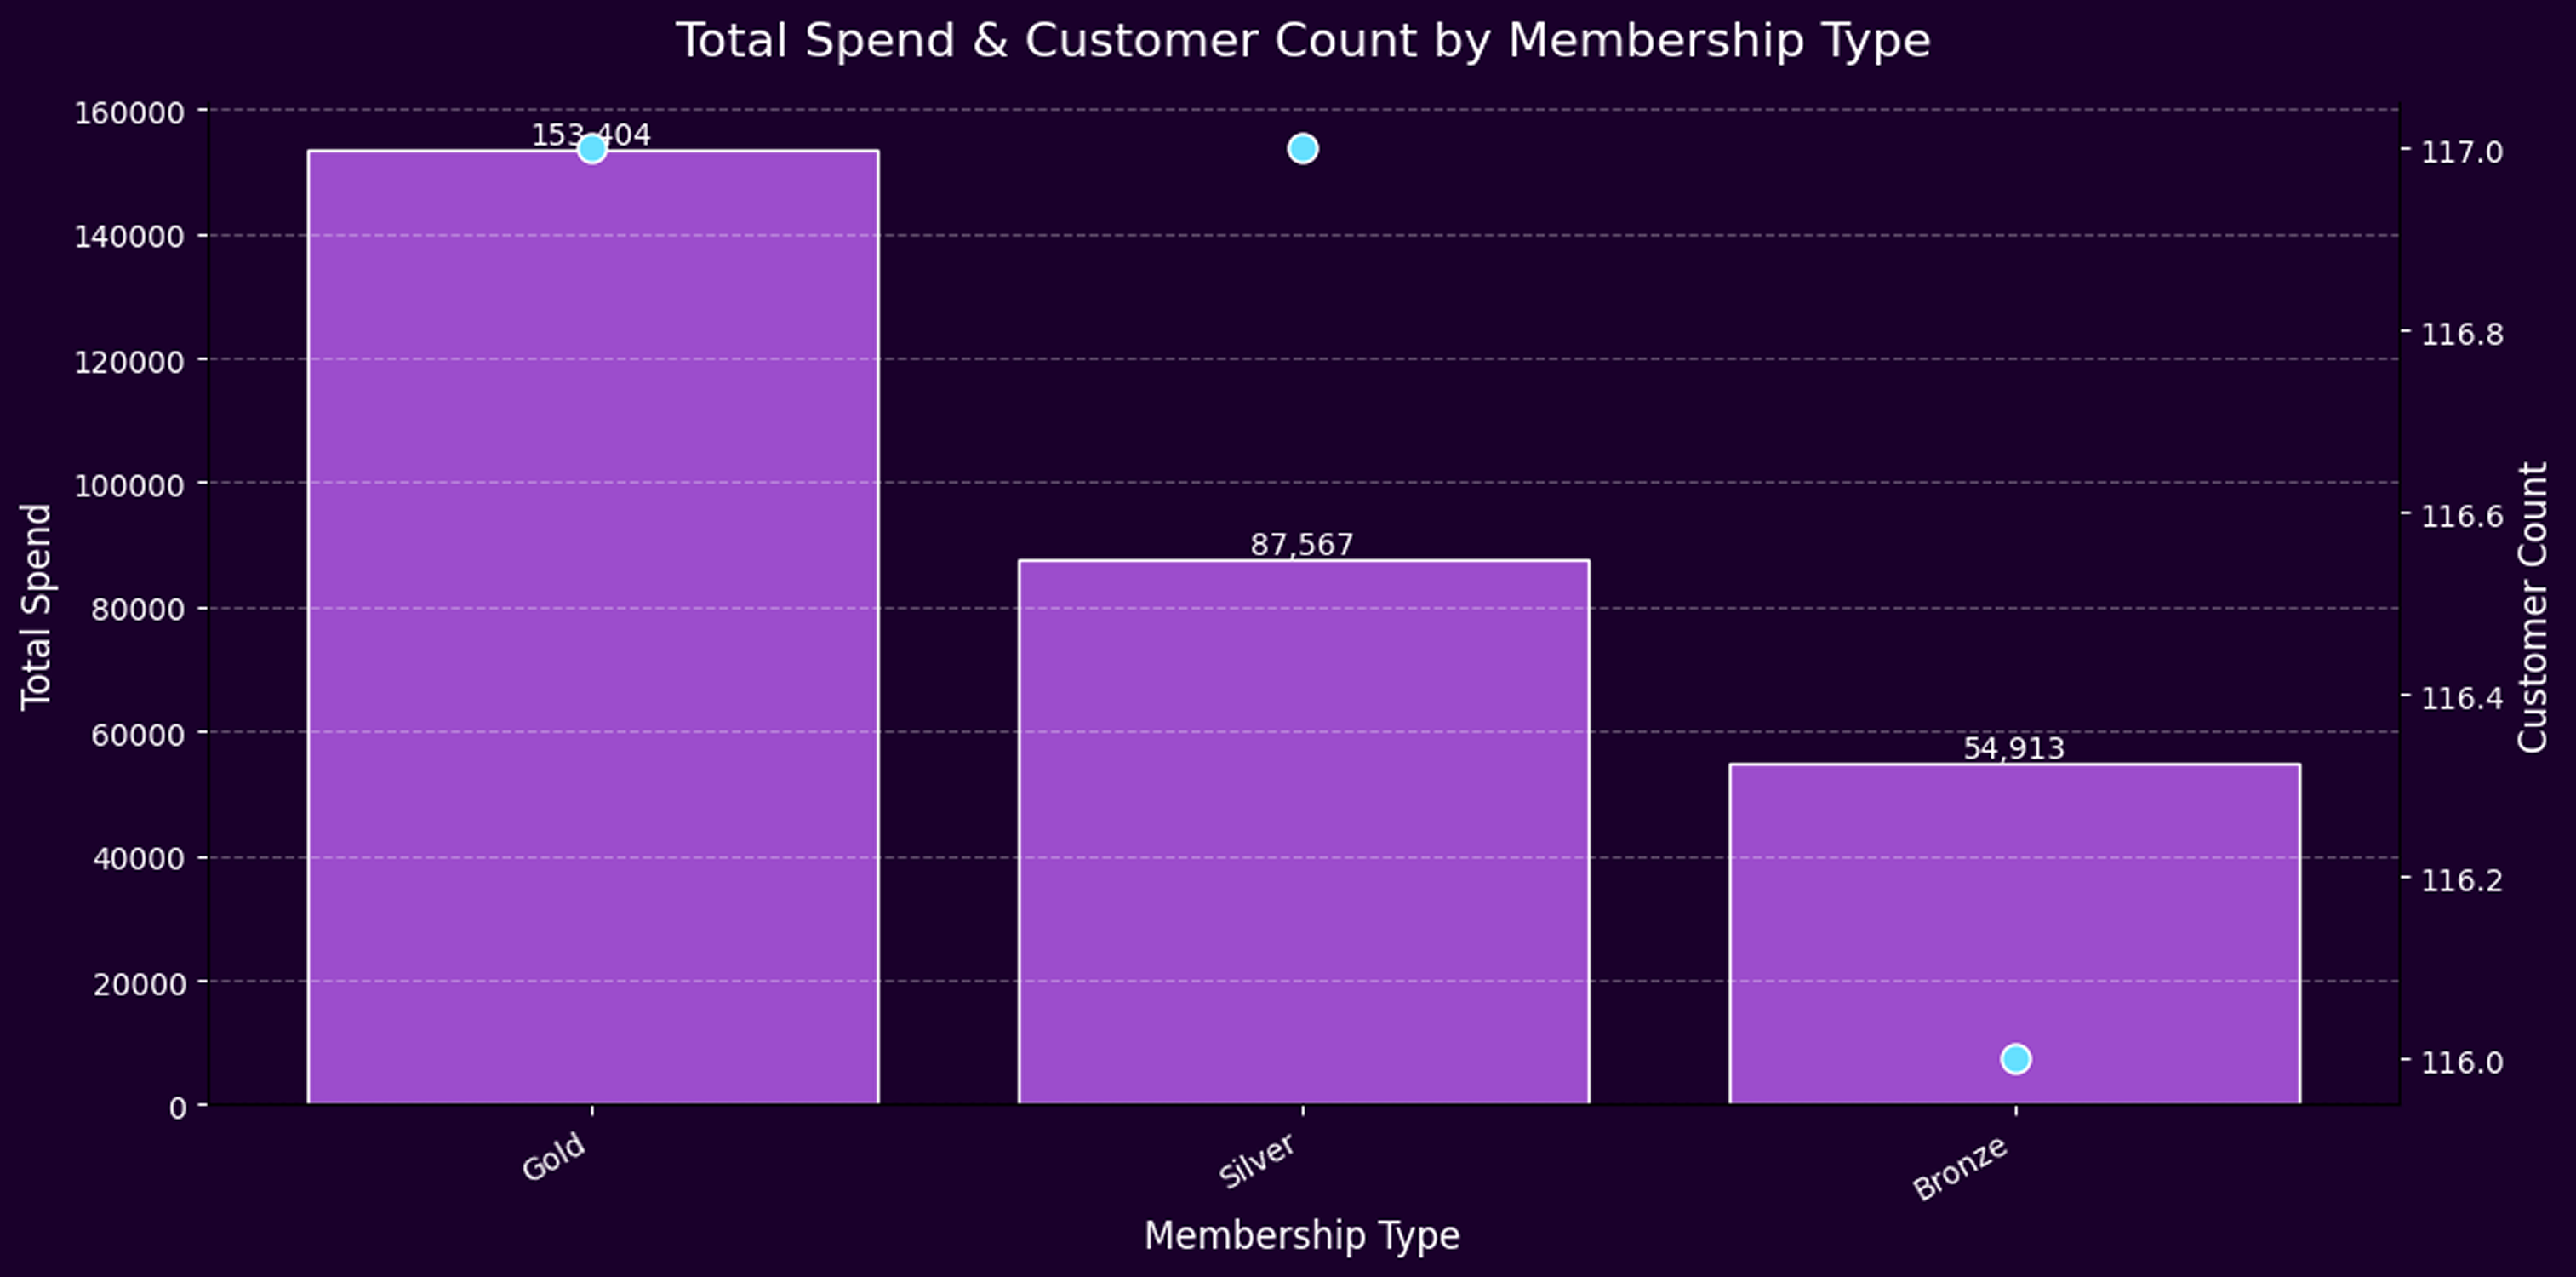
Our findings reveal that San Francisco generates higher total spend than New York despite having a slightly smaller customer base, showing that revenue potential is not solely tied to volume. Gender-based insights indicate that male customers spend significantly more, purchase more items, and express higher satisfaction, while female customers report a greater proportion of dissatisfaction. Addressing this gap presents a clear opportunity to enhance satisfaction and increase revenue from the female segment. Age analysis shows that while 30-year-olds are the most numerous, 24-year-olds lead in per-person spending and purchasing, suggesting that targeted engagement with high-value age cohorts could yield substantial returns. Membership analysis confirms that Gold-tier customers spend more, reinforcing the value of optimizing membership benefits to encourage upgrades.
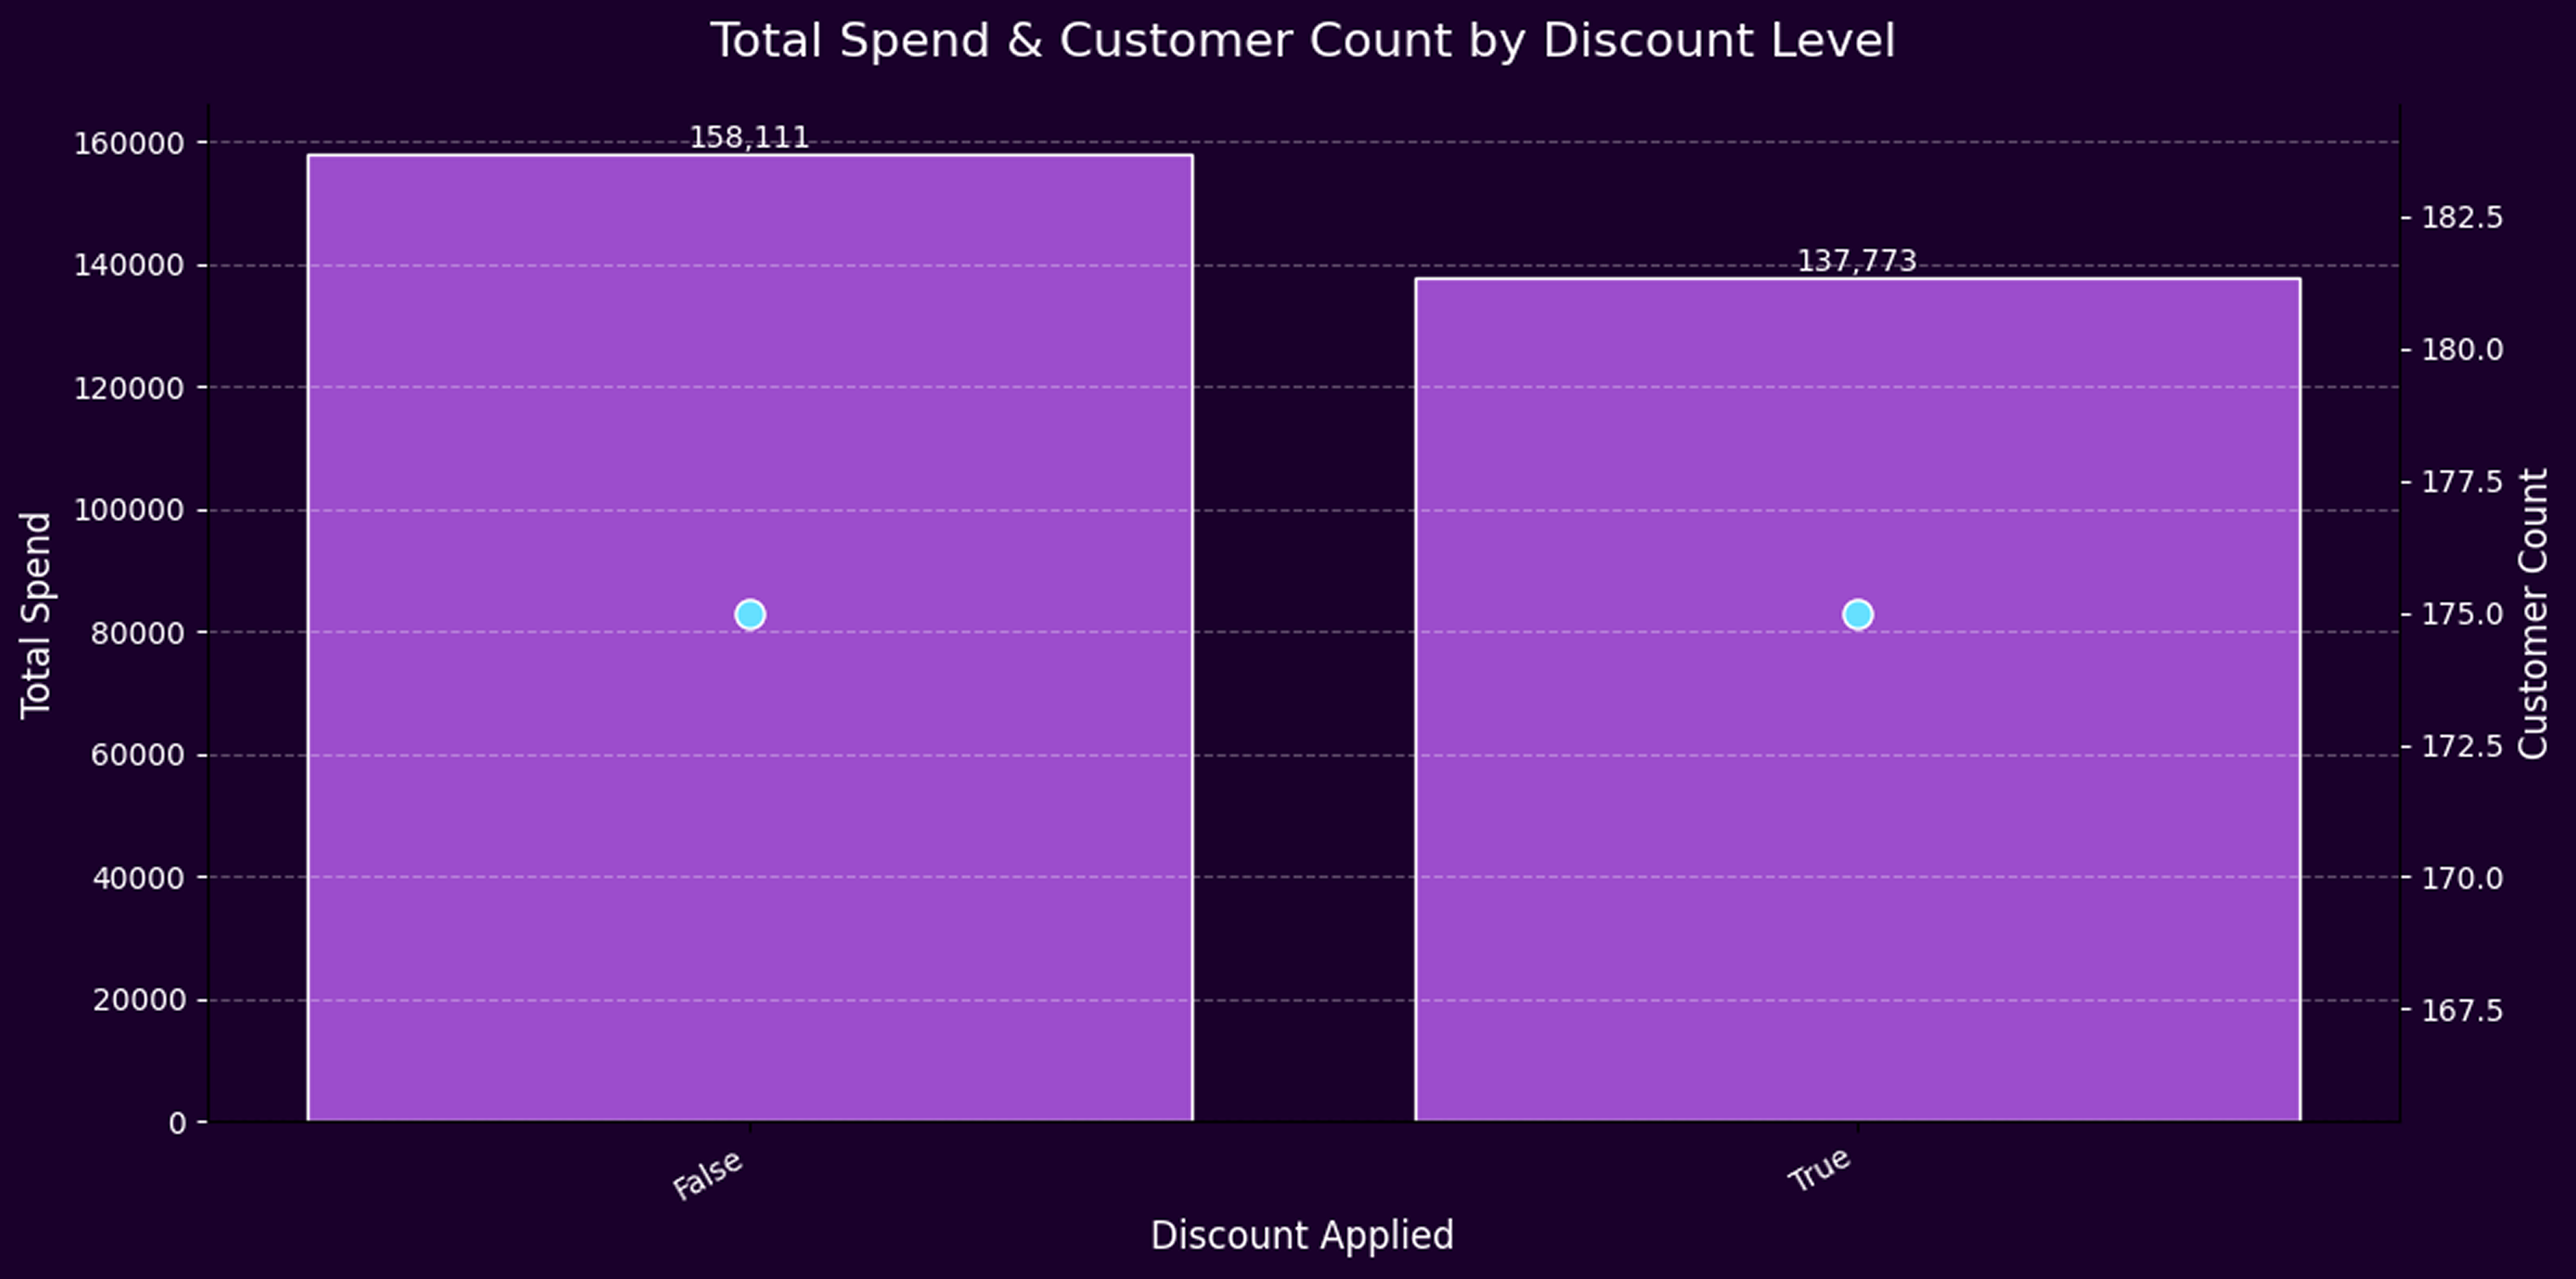
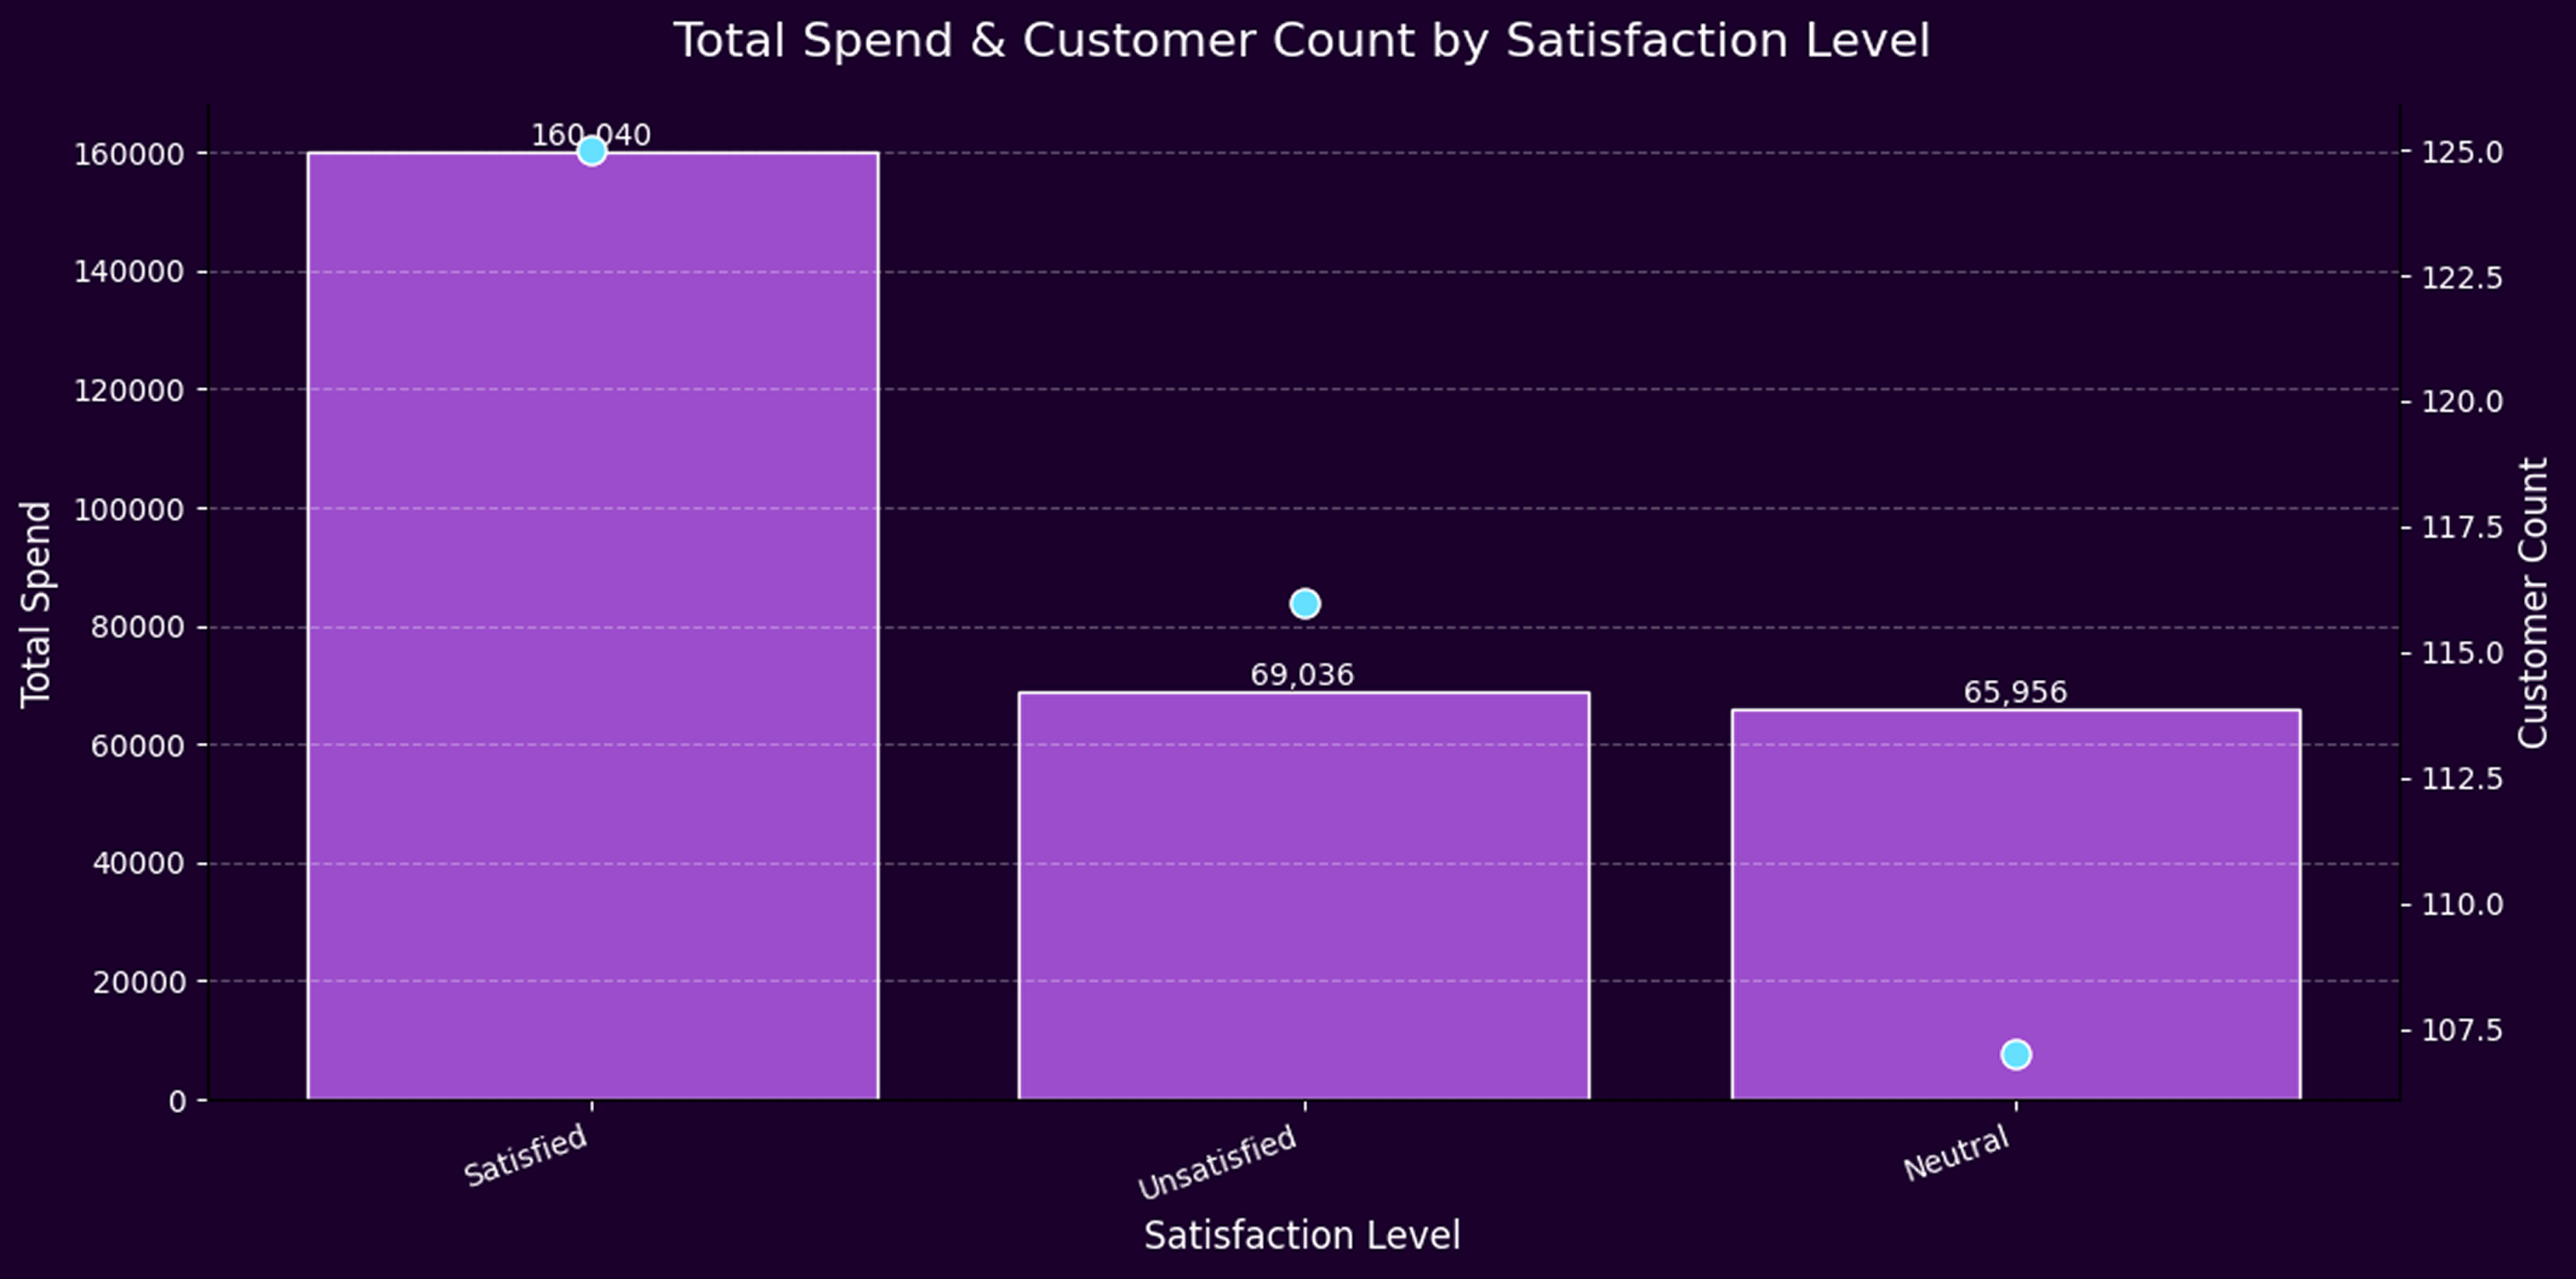
Interestingly, purchase patterns challenge conventional assumptions about discounting: customers who buy without discounts spend more and purchase more items than those who do, suggesting the need to reassess promotional strategies for profitability. Satisfaction levels further underline the importance of experience quality; satisfied customers spend the most, yet the presence of a large neutral and unsatisfied segment signals untapped potential for growth through service or product improvements.
Taken together, these findings demonstrate that customer behavior analysis is more than a descriptive exercise—it is a strategic tool for uncovering revenue levers, improving customer experiences, and guiding resource allocation. By translating insights into targeted actions, organizations can move from broad, undifferentiated strategies to focused, data-driven decision-making that maximizes both profitability and customer loyalty.
View the full code behind this analysis in our Google Colab notebook.