This analysis underscores the transformative potential of data science in retail operations—revealing hidden inefficiencies, quantifying financial leakage, and enabling more strategic, evidence-based purchasing decisions. For the liquor retail chain under study, several key insights emerged:
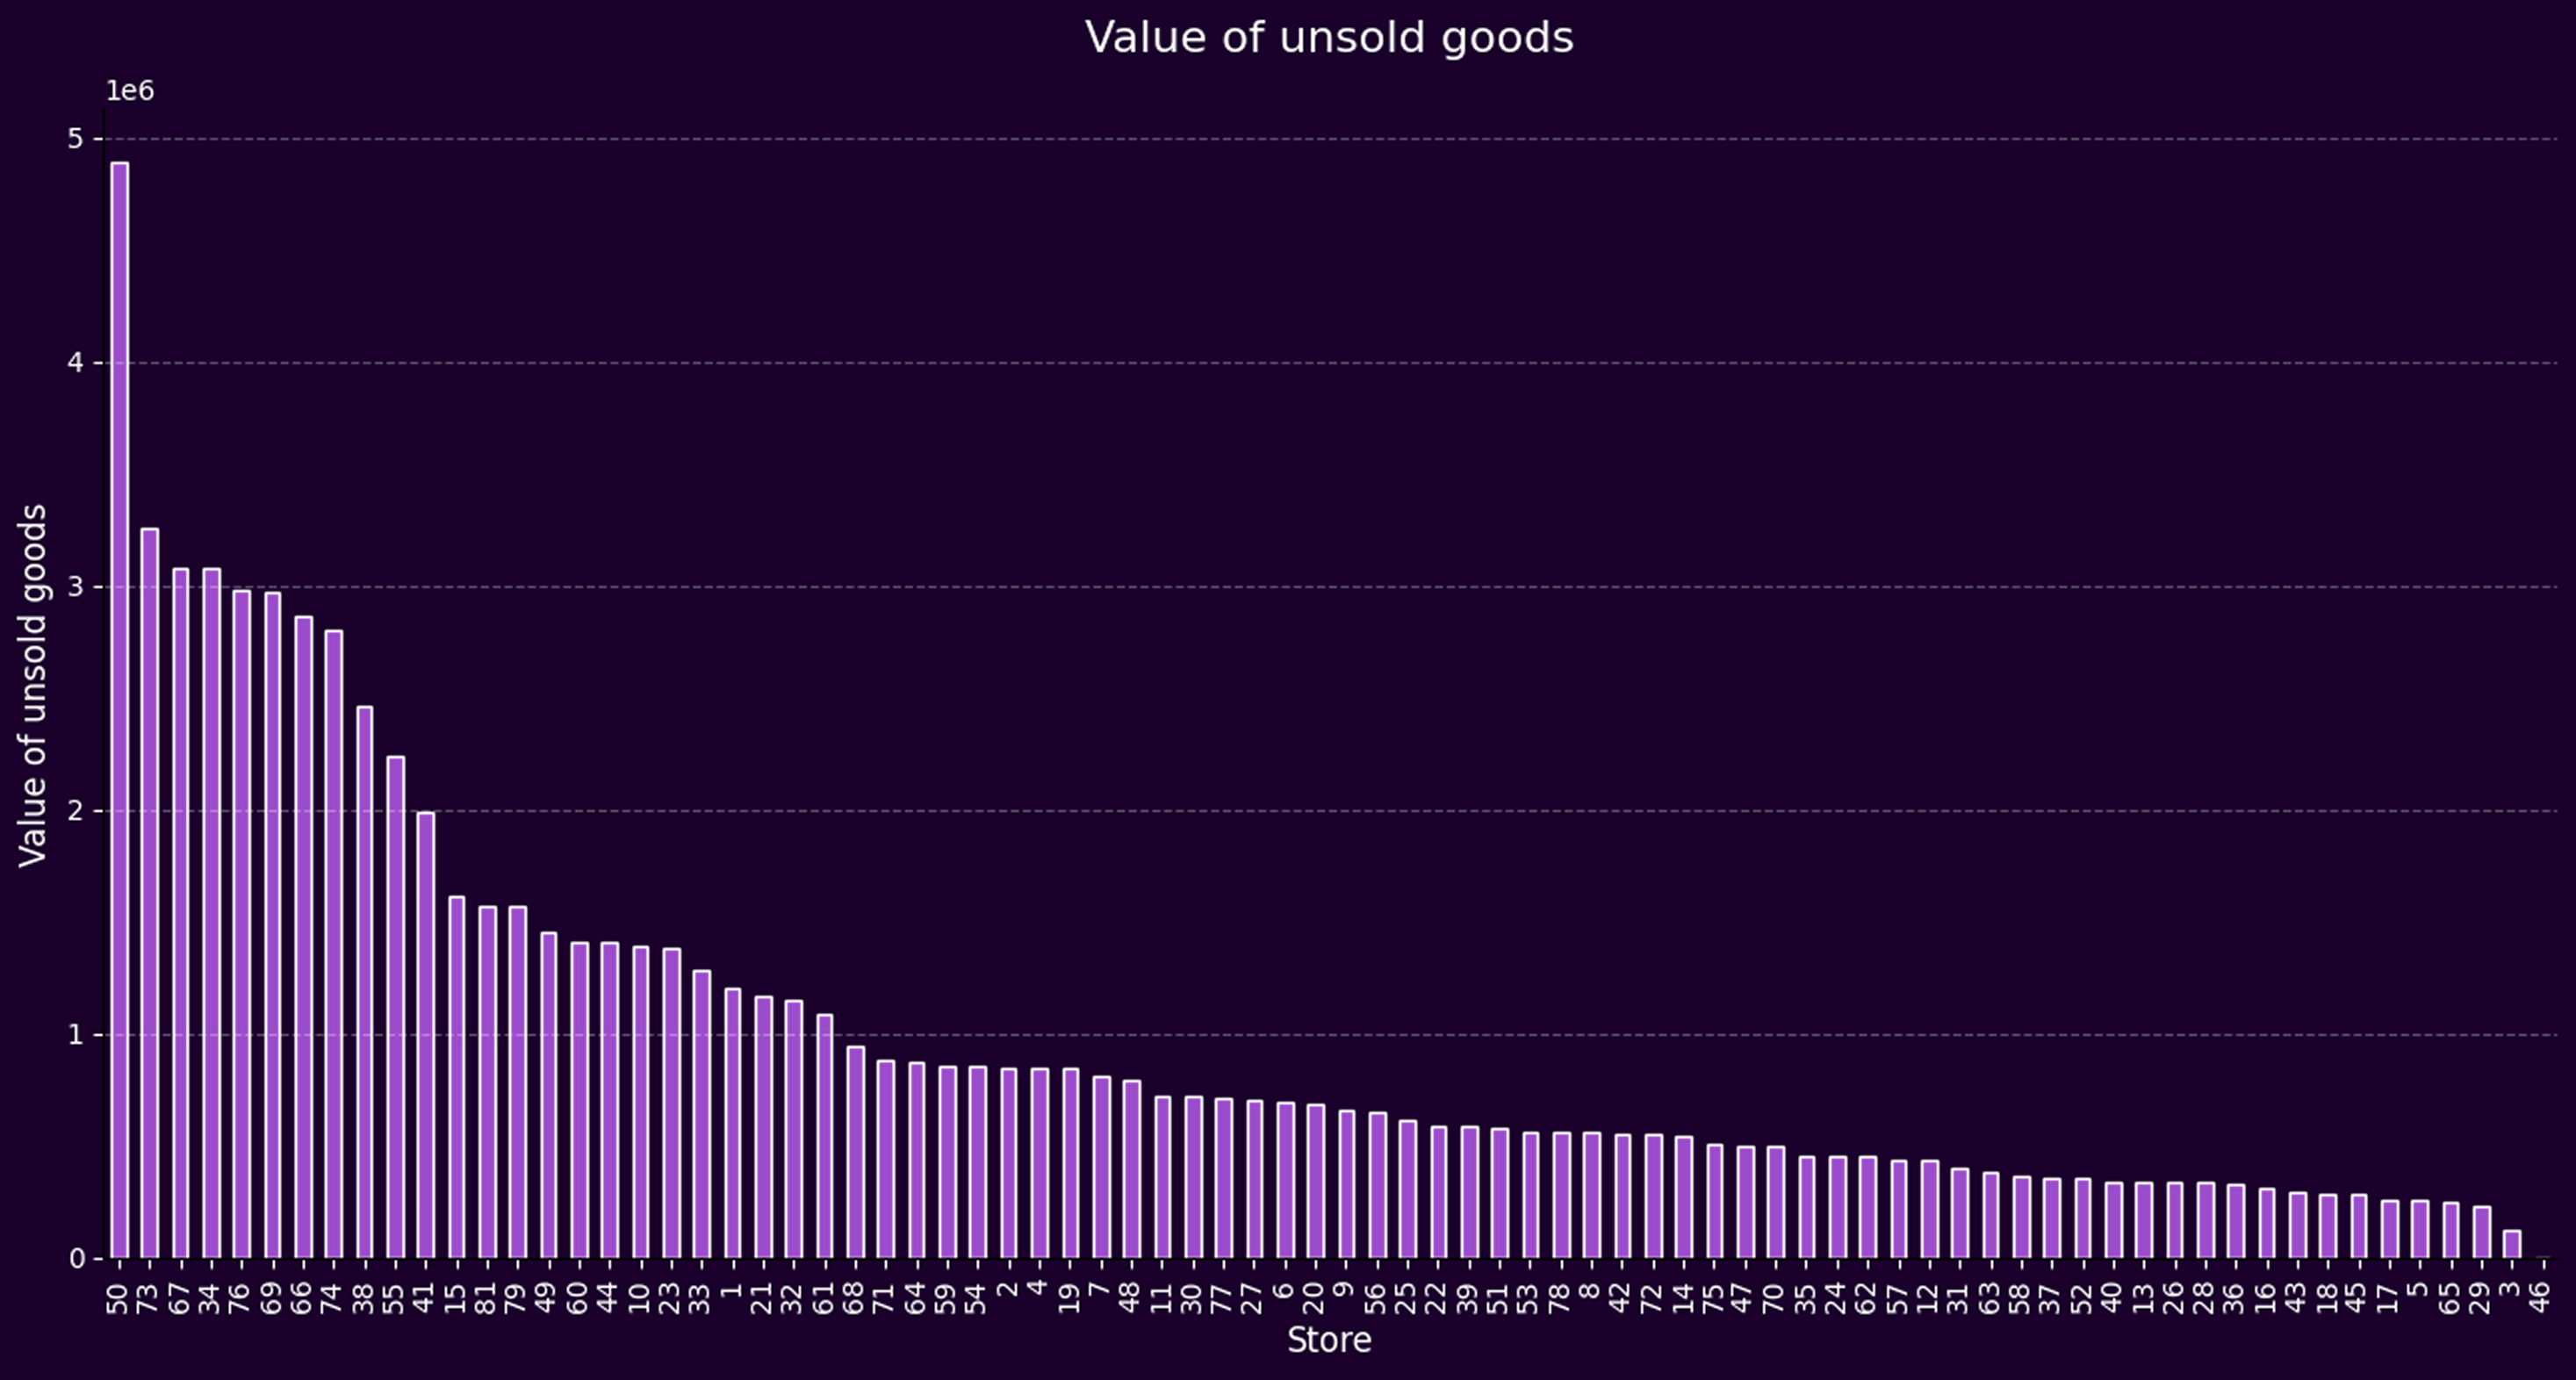
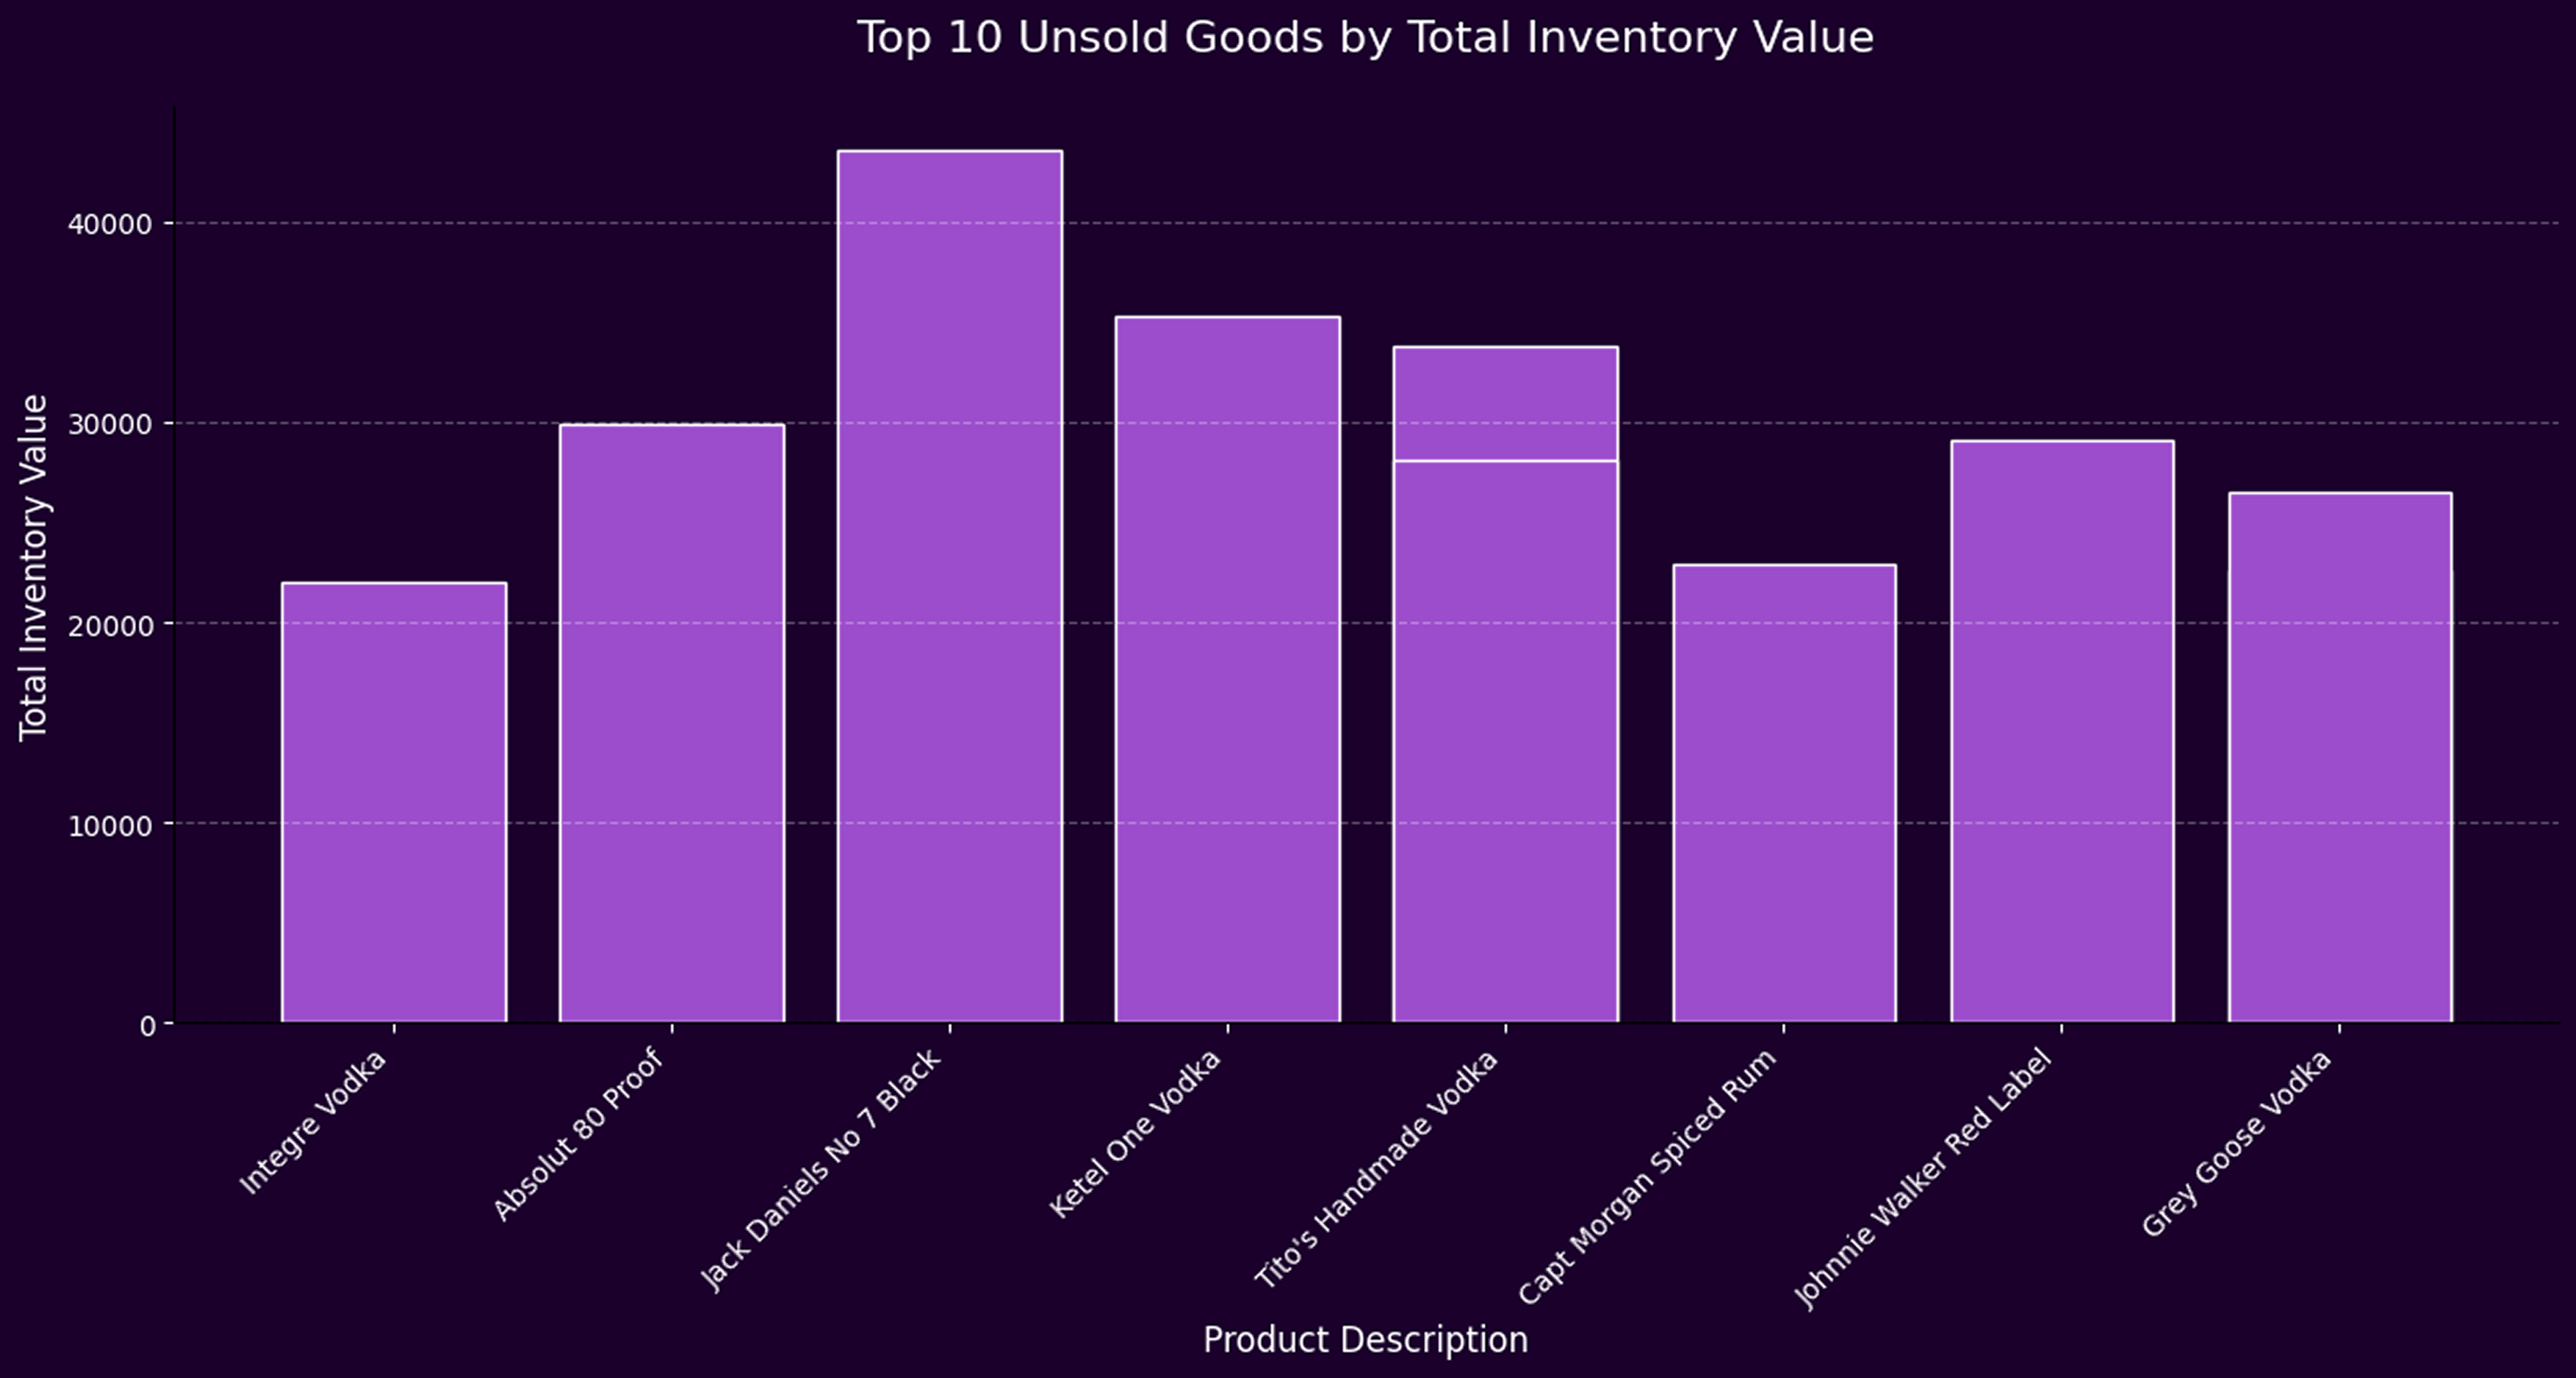
- Excess inventory is placing a significant drag on profitability, with certain stores—like Store 50—holding millions in unsold stock.
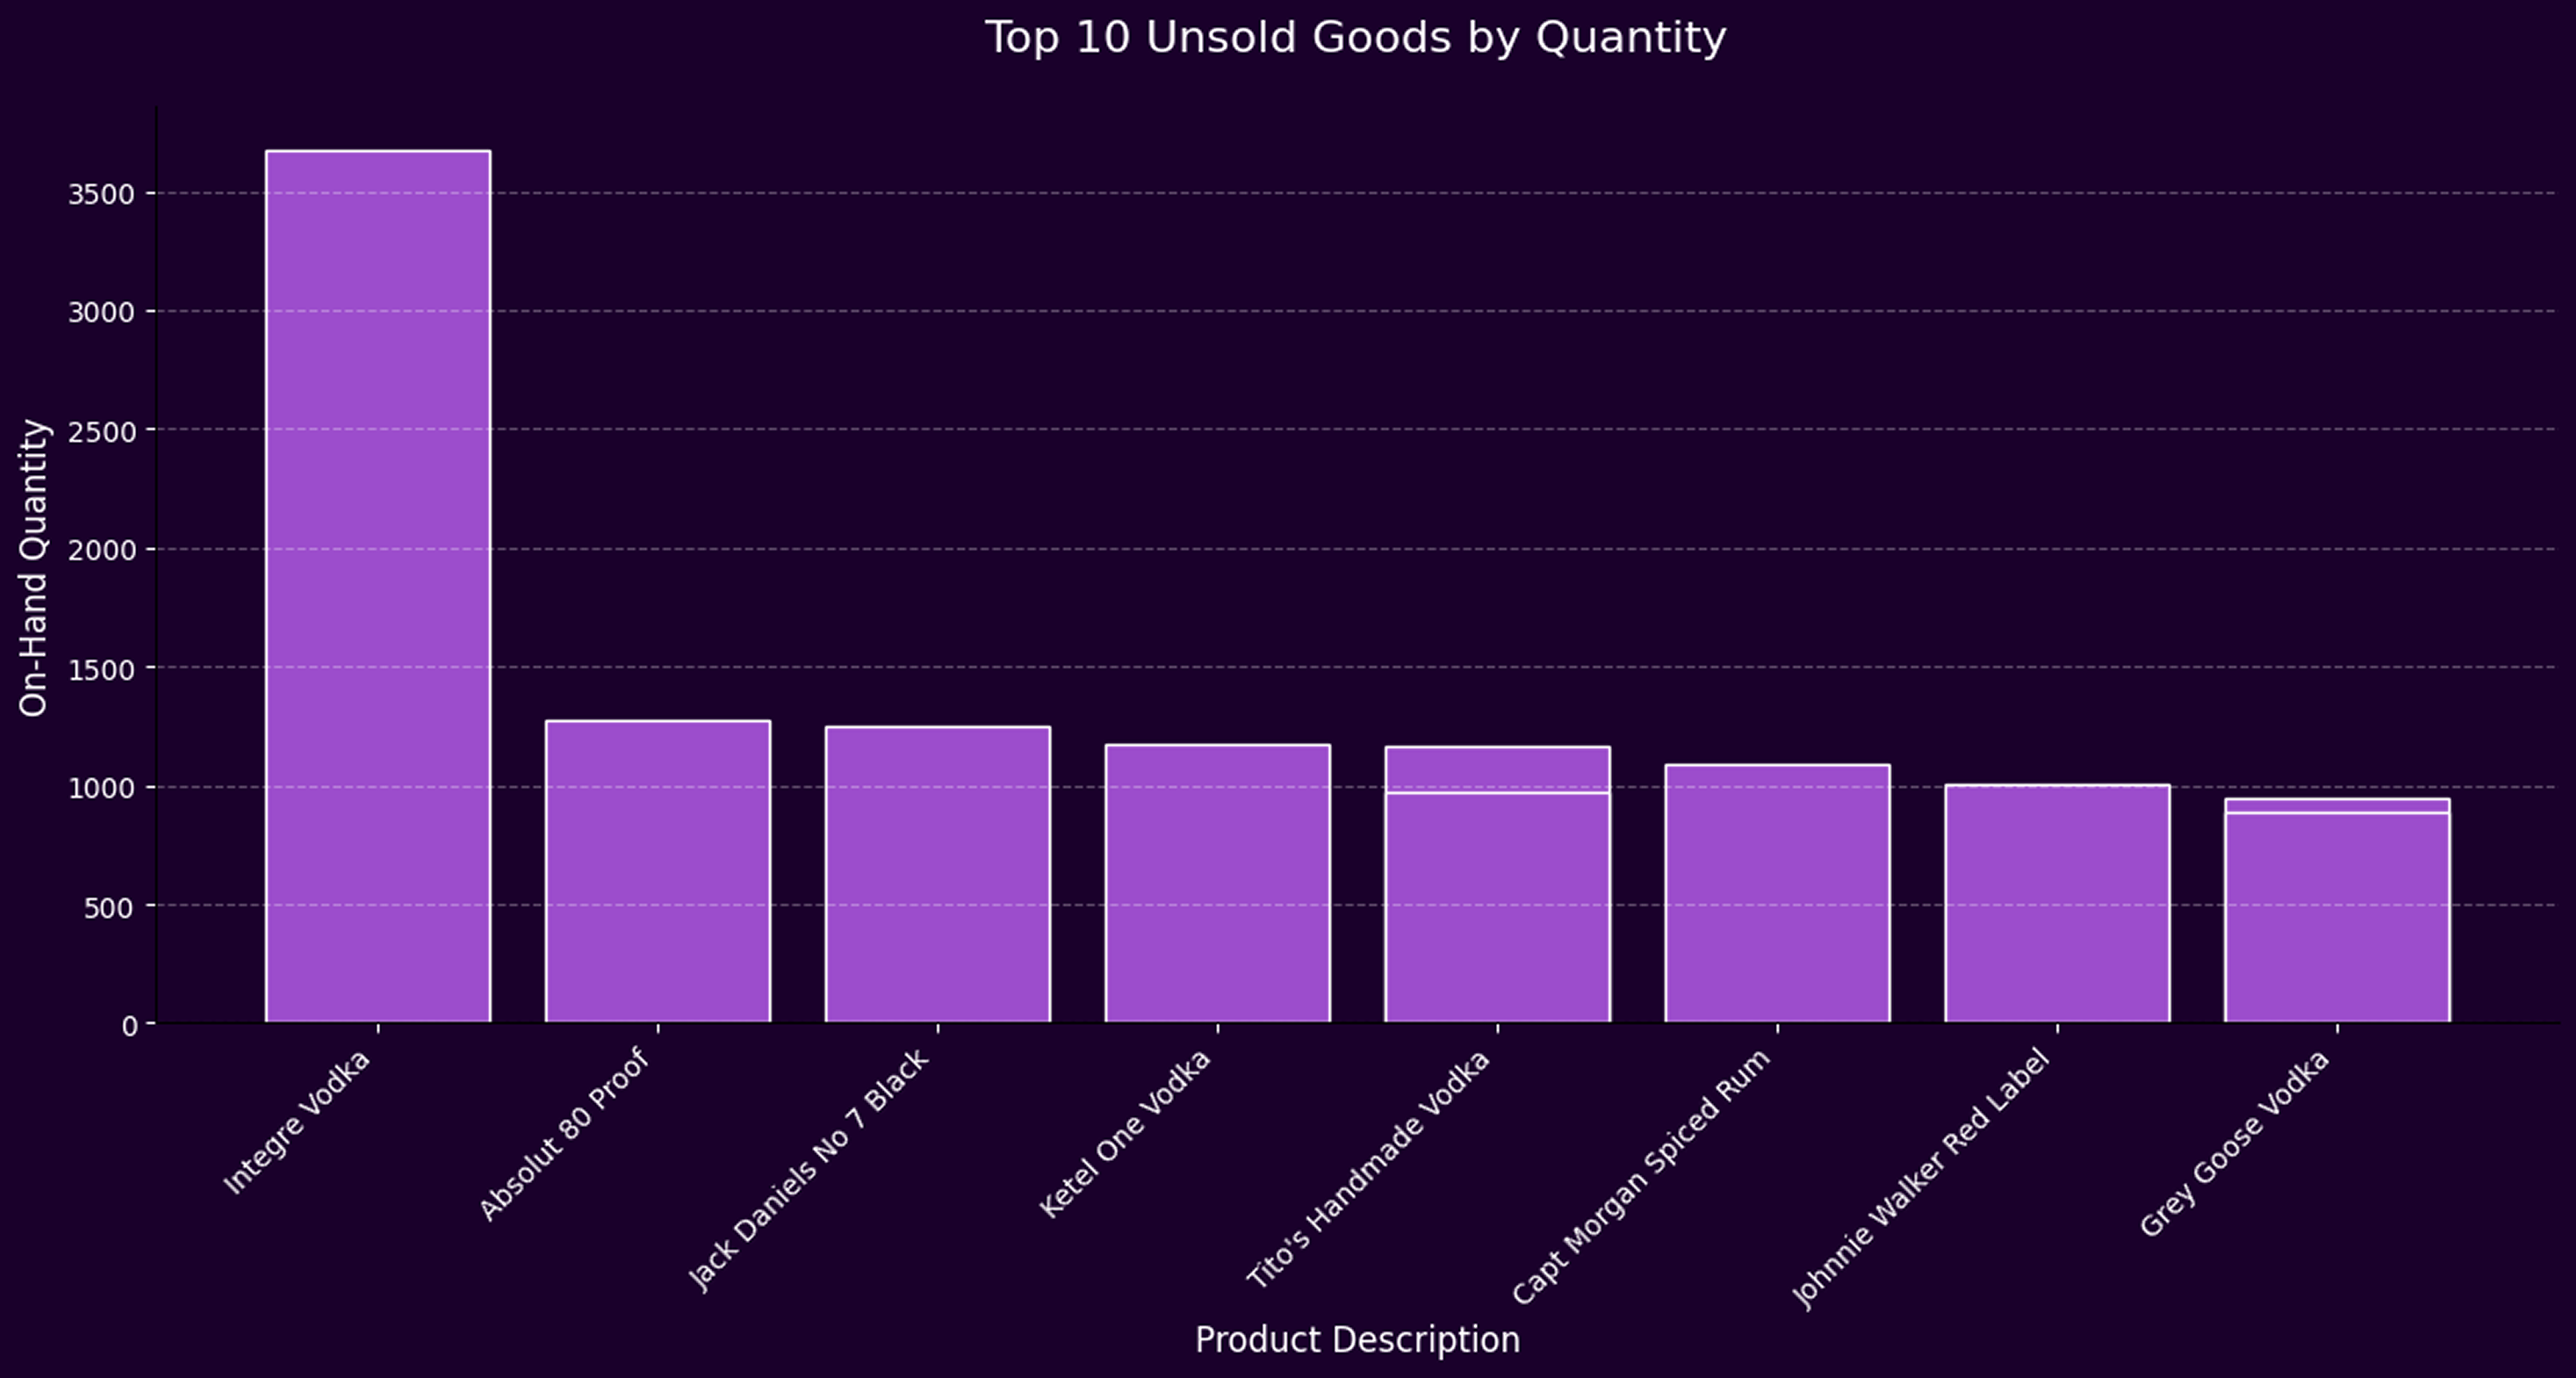
- A persistent disconnect between supply and actual customer demand is evident, especially across high-volume product categories like vodka.
- Store-level demand forecasting holds immense value in aligning procurement with local sales behavior, minimizing waste and optimizing cash flow.
To address these challenges, we advocate for the adoption of predictive analytics tools that transform historical sales patterns into forward-looking recommendations. When applied consistently, such tools allow organizations to:
- Reduce capital lockup by minimizing unsold inventory.
- Enhance store-level profitability through smarter purchasing.
- Improve warehouse efficiency with more accurate demand signals.
- Empower local managers through decentralized, data-informed decision-making.
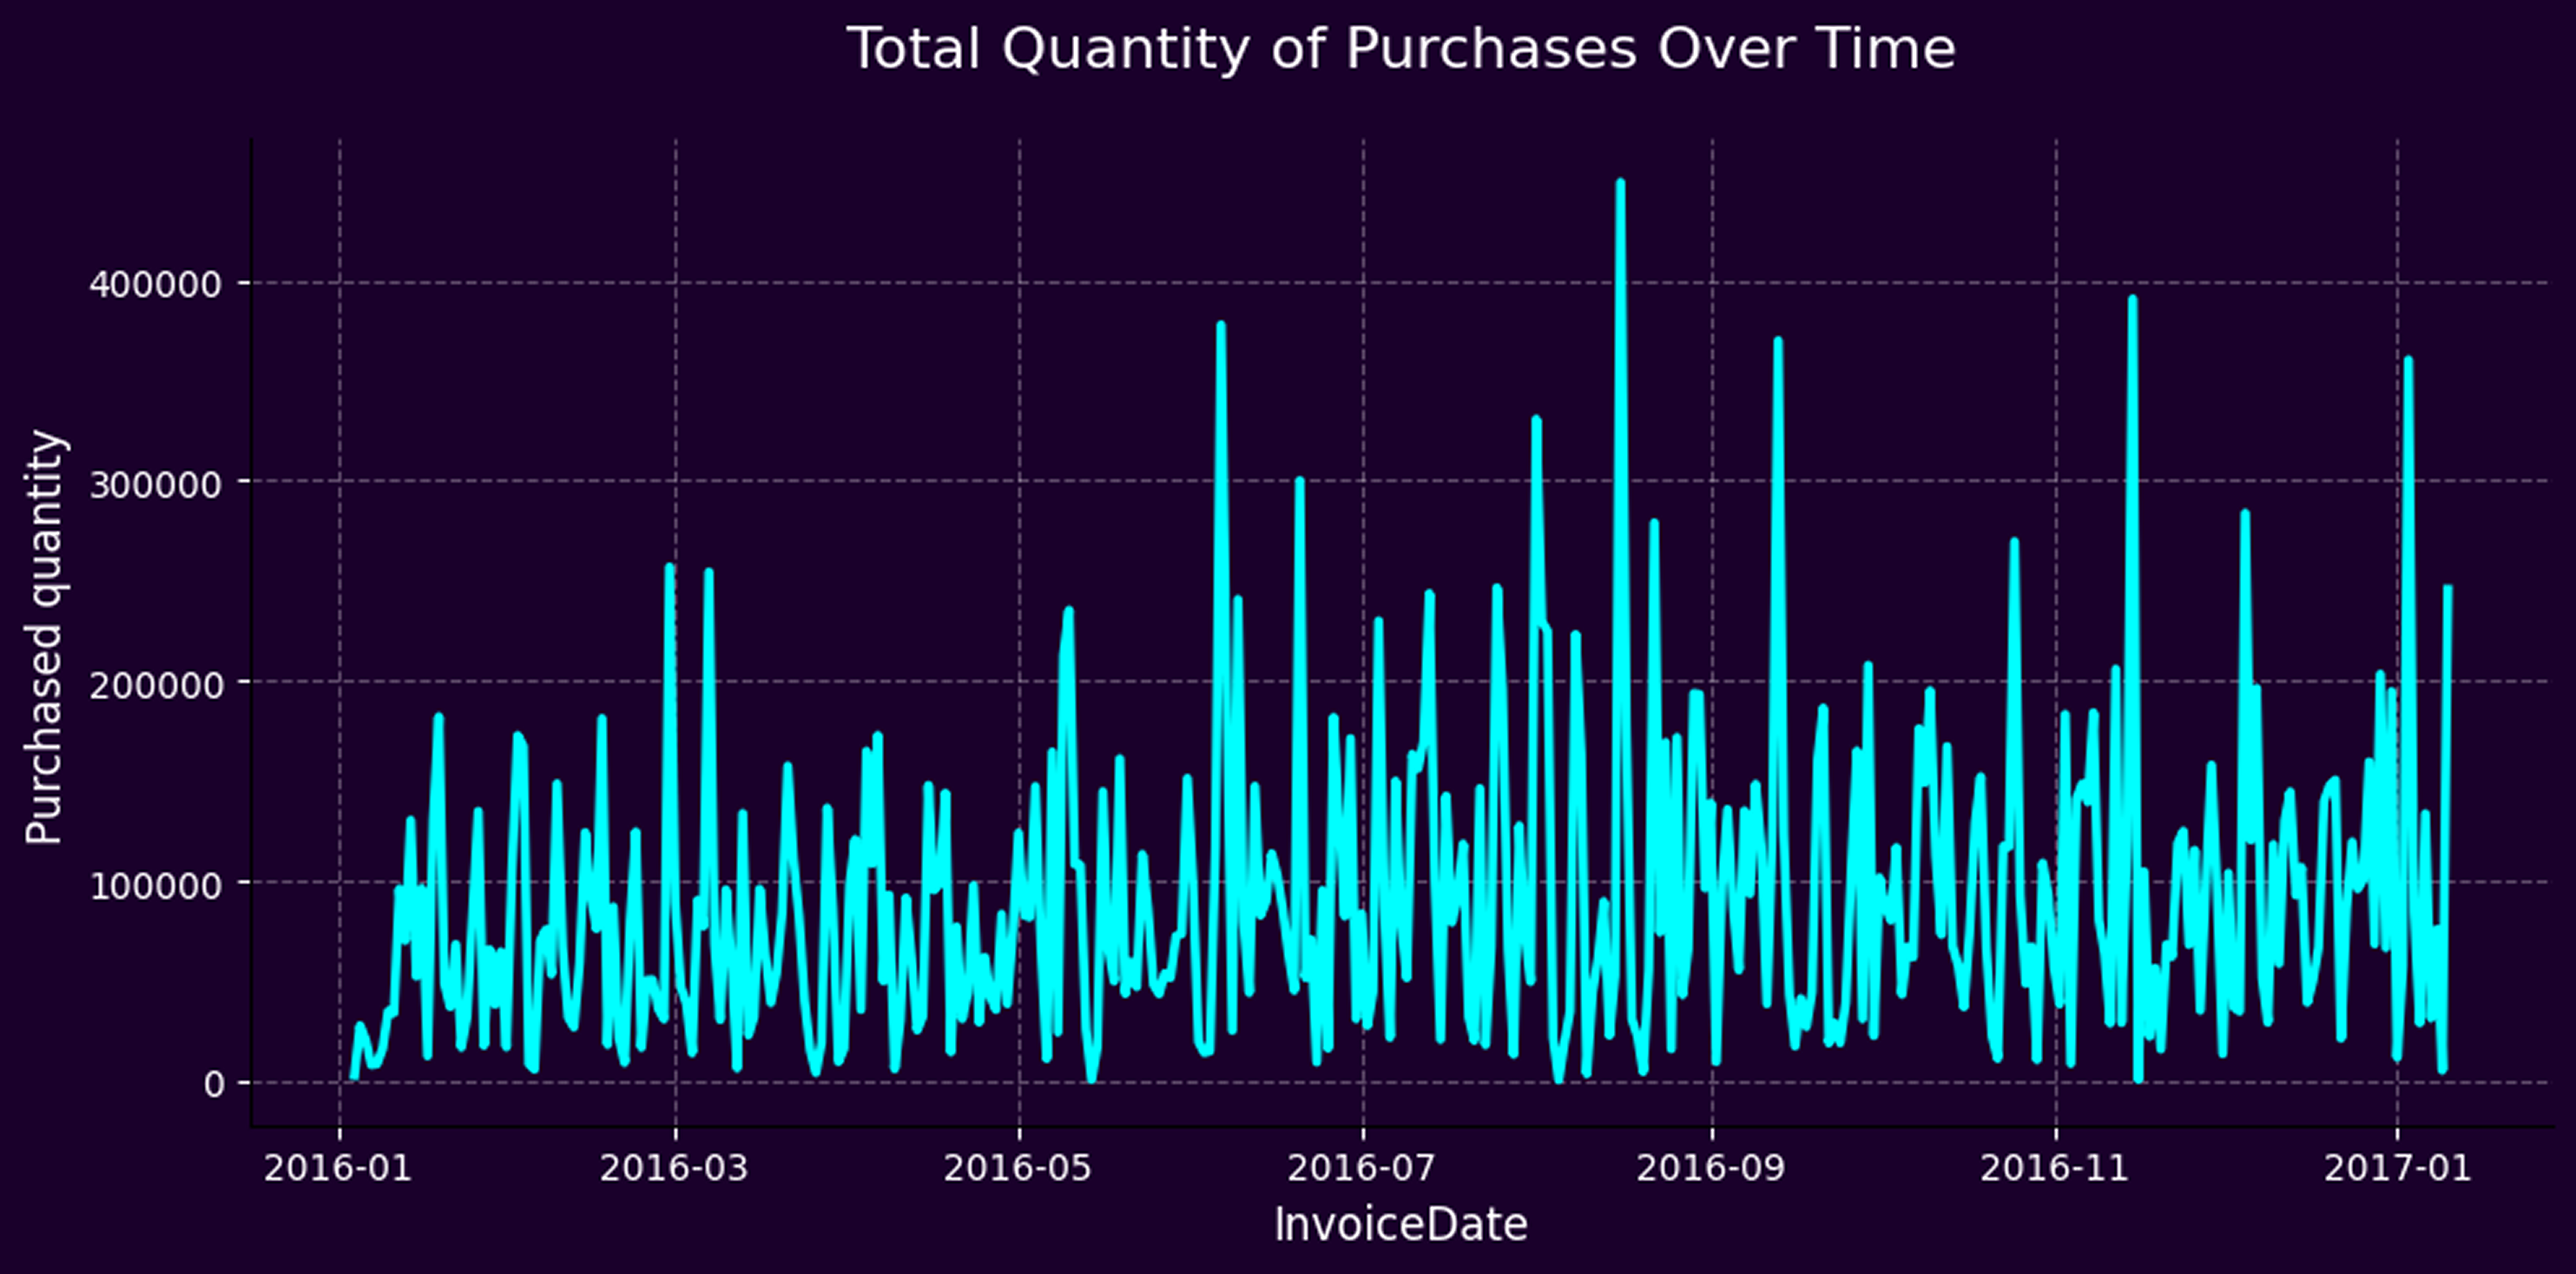
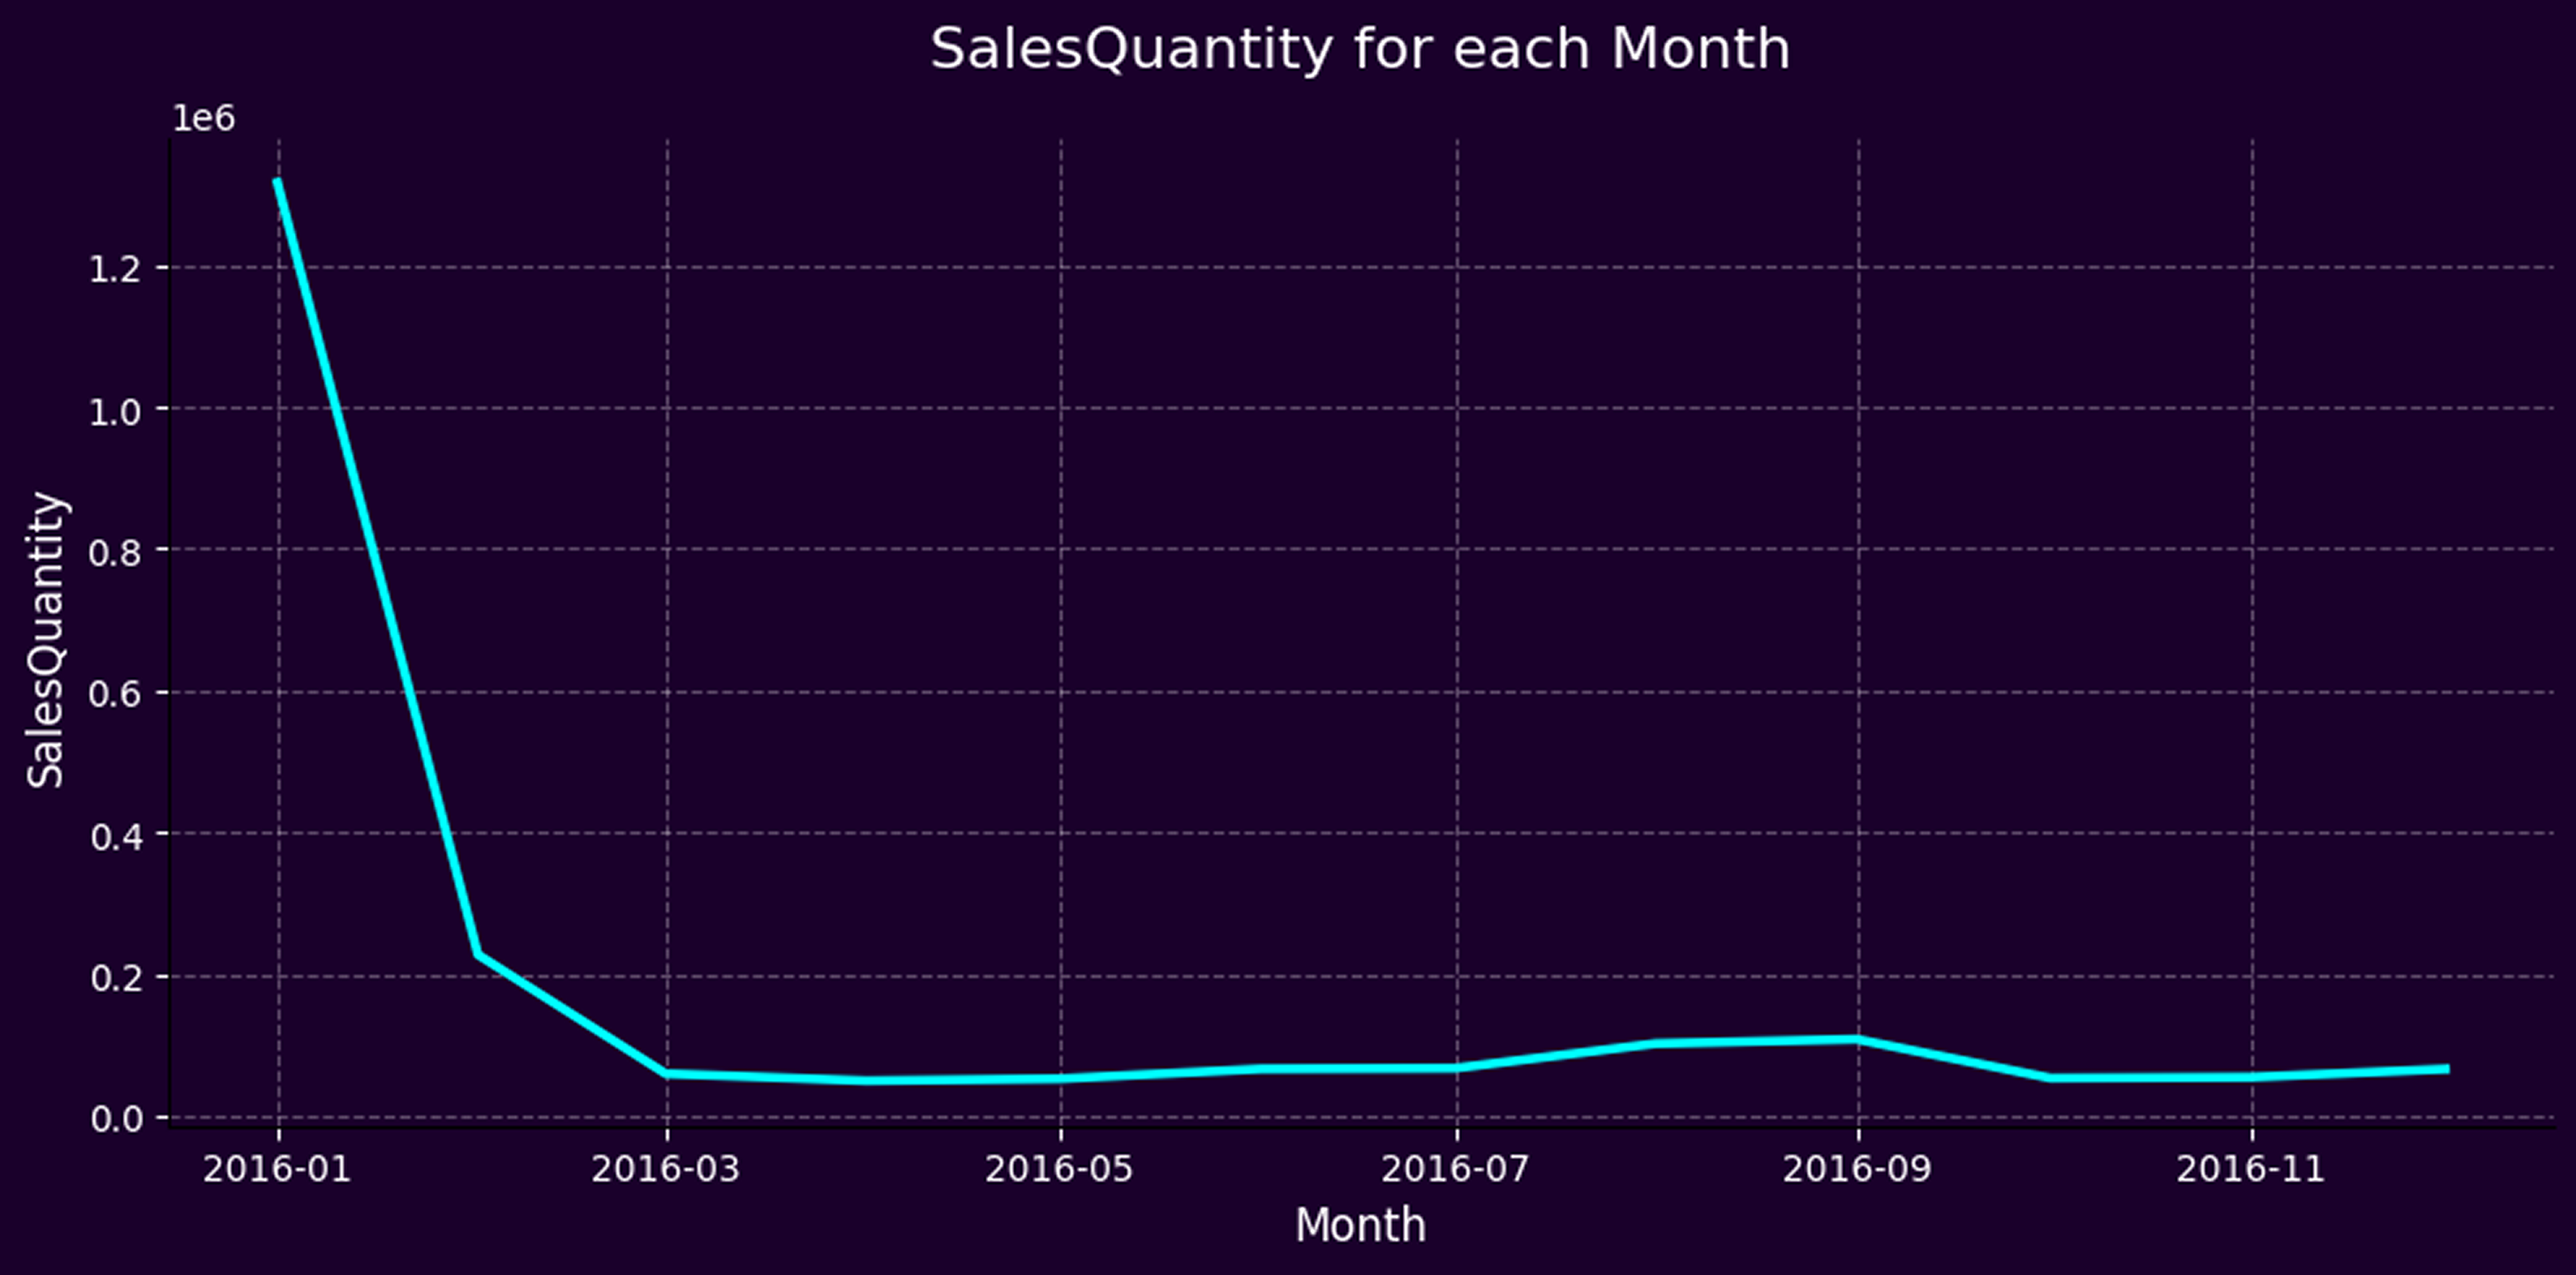
Importantly, while the model provides robust monthly demand forecasts, it is based on one year of historical data. To avoid distortion caused by seasonal spikes, we excluded January and February—months that showed unusually high sales likely tied to holidays and New Year events. Managers using the tool should remain mindful of these seasonal peaks and proactively adjust their purchase plans for such periods, anticipating higher-than-average demand.
In conclusion, this initiative demonstrates that inventory planning is no longer a function of guesswork or static rules. With machine learning and store-level analytics, retail organizations can shift from reactive stock management to a predictive, agile approach—ensuring better financial outcomes and stronger customer satisfaction.
View the full code behind this analysis in our Google Colab notebook.