Retail Sales Forecasting Using Machine Learning: A Data-Driven Approach

How a real-world ML approach can forecast retail trends using open data.

Retail Sales Forecasting

This article demonstrates Whylitics' forecasting methodology using a public dataset to protect client confidentiality.

As part of our Market Forecasting services at Whylitics, we empower organizations to anticipate customer demand, revenue fluctuations, and regional growth potential. To showcase our approach while safeguarding client privacy, we leverage an anonymized retail dataset from Kaggle.

This dataset covers weekly sales from 45 stores across various departments and includes three data sources:

The goal was to predict future weekly sales. However, the challenge included working with partially obscured variables like unknown store types and markdown categories—reflecting the ambiguity often present in real-world datasets.

Exploratory Insights

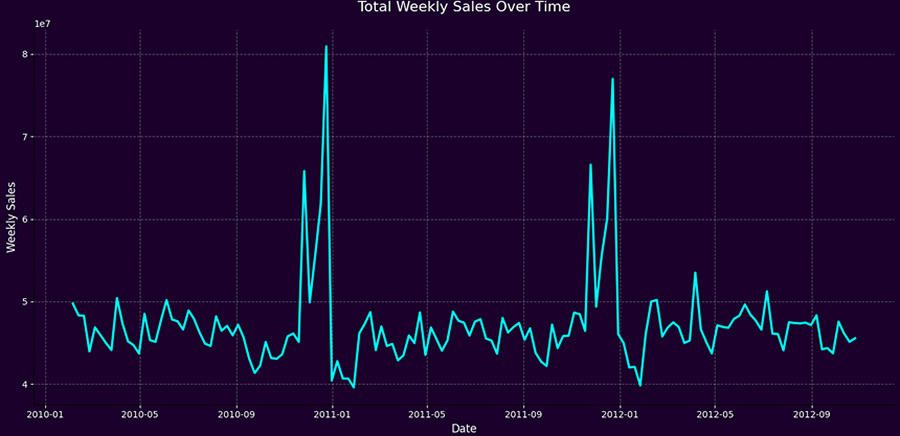
Seasonal trends were the first to emerge. Sales spiked sharply between mid-November and the New Year, emphasizing the influence of holiday events. We compared holiday weeks with regular weeks by calculating average daily revenue and found that, while holidays bring surges, regular weekdays remain slightly stronger in daily performance.

Markdown analysis revealed a counterintuitive trend: higher weekly sales often occurred alongside lower markdown values. This likely reflects pricing tiers—lower-priced, high-demand goods require minimal discounts to move volume.

Retail Sales

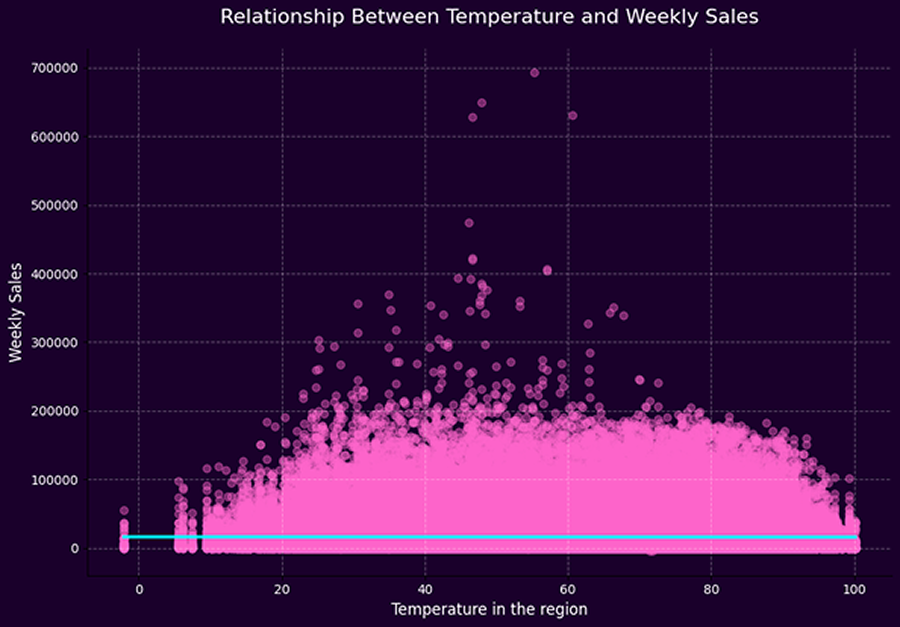
Environmental and macroeconomic factors were also examined:

Retail Temperature

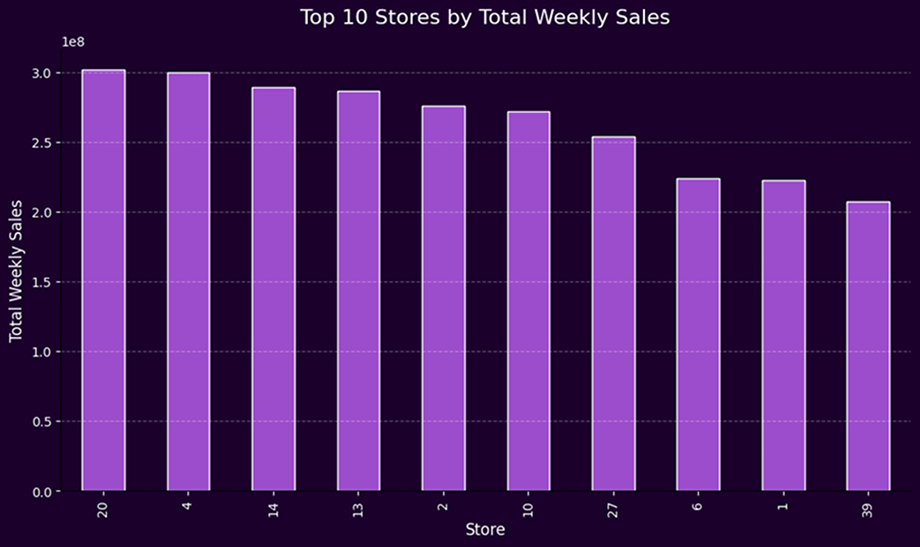
We then identified the top 10 stores by total revenue—each labeled as type "A." Although anonymized, this consistent label likely indicates high-traffic, flagship stores.

Retail Top Stores

Modeling Sales Performance

We selected LightGBM for modeling due to its efficiency, scalability, and native support for categorical features. The initial model achieved:

To improve this baseline, we introduced two key temporal features:

These additions provided temporal memory and sales context. Feature importance plots then guided retraining with the 10 most influential features.

The enhanced model significantly outperformed the original:

Conclusion: Forecasting Sales with Confidence

The results from our enhanced LightGBM model illustrate the real potential of data-driven retail forecasting. With over 97% of variance explained and prediction accuracy improving by 2x after feature optimization, this approach proves not just feasible but powerful.

While this study relied on open data, using your organization’s own sales history, campaign structure, and store metadata can yield even more precise insights. Integrating internal KPIs and business events can further elevate the model’s predictive power.

This example was designed to simulate our forecasting workflow without exposing real customer data. It demonstrates how Whylitics combines EDA, feature engineering, and machine learning to make forecasting actionable and business-aligned.

The takeaway: Predictive insights are not magic—they are measurable, testable, and extremely valuable. We help you unlock them.

View the full code behind this analysis in our Google Colab notebook.